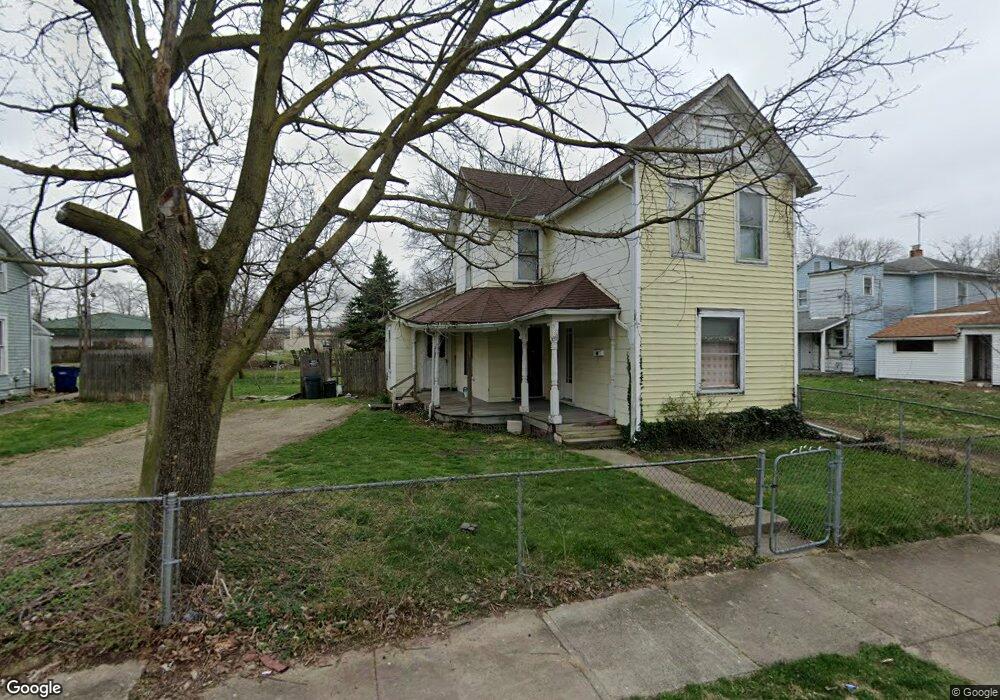
527 Cedar St Springfield, OH 45504
Estimated Value: $80,840 - $107,000
2
Beds
1
Bath
1,386
Sq Ft
$68/Sq Ft
Est. Value
About This Home
This home is located at 527 Cedar St, Springfield, OH 45504 and is currently estimated at $93,960, approximately $67 per square foot. 527 Cedar St is a home located in Clark County with nearby schools including Snowhill Elementary School, Roosevelt Middle School, and Springfield High School.
Ownership History
Date
Name
Owned For
Owner Type
Purchase Details
Closed on
Mar 7, 2000
Sold by
Miller Sam
Bought by
Bumpus Catherine M
Current Estimated Value
Home Financials for this Owner
Home Financials are based on the most recent Mortgage that was taken out on this home.
Original Mortgage
$38,855
Outstanding Balance
$12,531
Interest Rate
8.26%
Mortgage Type
FHA
Estimated Equity
$81,429
Purchase Details
Closed on
Nov 12, 1998
Sold by
Smith Richard L
Bought by
Miller Sam
Create a Home Valuation Report for This Property
The Home Valuation Report is an in-depth analysis detailing your home's value as well as a comparison with similar homes in the area
Home Values in the Area
Average Home Value in this Area
Purchase History
| Date | Buyer | Sale Price | Title Company |
|---|---|---|---|
| Bumpus Catherine M | $45,000 | -- | |
| Miller Sam | $20,000 | -- |
Source: Public Records
Mortgage History
| Date | Status | Borrower | Loan Amount |
|---|---|---|---|
| Open | Bumpus Catherine M | $38,855 |
Source: Public Records
Tax History
| Year | Tax Paid | Tax Assessment Tax Assessment Total Assessment is a certain percentage of the fair market value that is determined by local assessors to be the total taxable value of land and additions on the property. | Land | Improvement |
|---|---|---|---|---|
| 2025 | $748 | $19,890 | $4,270 | $15,620 |
| 2024 | $729 | $14,750 | $3,690 | $11,060 |
| 2023 | $729 | $14,750 | $3,690 | $11,060 |
| 2022 | $746 | $14,750 | $3,690 | $11,060 |
| 2021 | $676 | $12,300 | $3,050 | $9,250 |
| 2020 | $677 | $12,300 | $3,050 | $9,250 |
| 2019 | $679 | $12,300 | $3,050 | $9,250 |
| 2018 | $694 | $12,060 | $3,590 | $8,470 |
| 2017 | $693 | $12,065 | $3,591 | $8,474 |
| 2016 | $694 | $12,065 | $3,591 | $8,474 |
| 2015 | $743 | $12,660 | $3,591 | $9,069 |
| 2014 | $740 | $12,660 | $3,591 | $9,069 |
| 2013 | $732 | $12,660 | $3,591 | $9,069 |
Source: Public Records
Map
Nearby Homes
- 222 N Race St Unit 224
- 705-705 1/2 Grant St Unit 705
- 705 Grant St Unit 705
- 511 N Light St
- 424-424 1/2 N Shaffer St
- 424 N Shaffer St
- 239 N Shaffer St
- 430 N Jackson St
- 423 N Jackson St Unit 425
- 727 W High St
- 101`103 N Western
- 120 E Ward St
- 38 W High St Unit 3B
- 366 N Isabella St
- 29 E Ward St
- 33-35 E Ward St
- 659 W Mulberry St Unit 661
- 709-711 W Mulberry St
- 1205 W High St
- 114-116 E Ward St
- 521 Cedar St
- 230 N Race St Unit 232
- 234 N Race St
- 236 N Race St Unit 238
- 226 N Race St Unit 228
- 517 Cedar St
- 224 N Race St
- 304 N Race St
- 216 N Race St
- 526 Cedar St
- 308 N Race St
- 520 Cedar St
- 212 N Race St Unit 214
- 530 W North St
- 231 N Yellow Springs St
- 227 N Yellow Springs St
- 237 N Yellow Springs St Unit 239
- 516 Cedar St
- 522 W North St Unit 524
- 312 N Race St
Your Personal Tour Guide
Ask me questions while you tour the home.