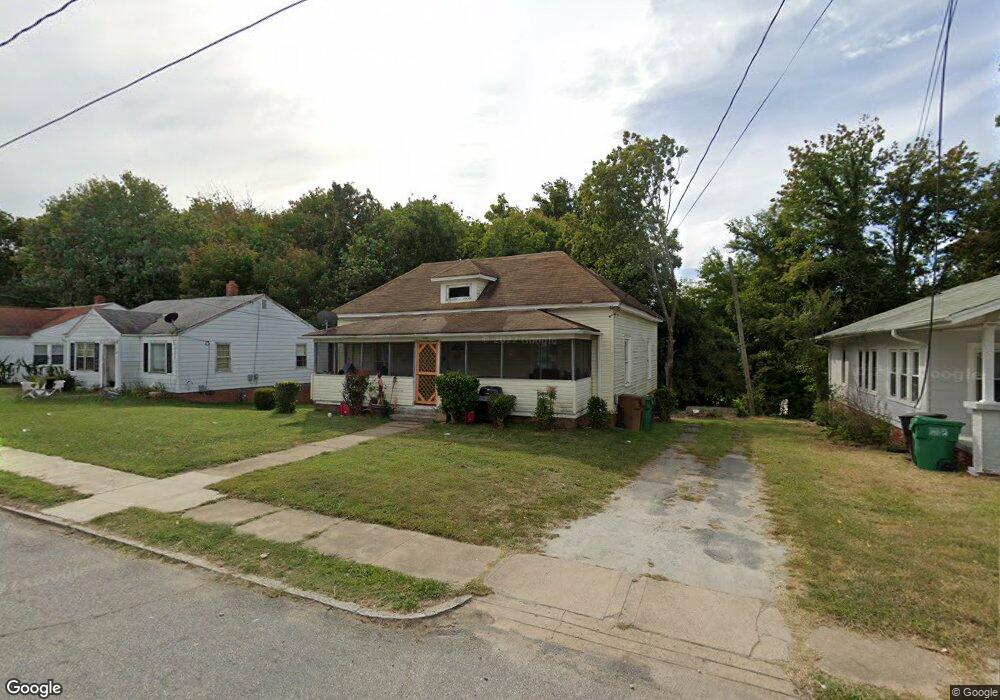
527 Denny St High Point, NC 27262
Downtown High Point NeighborhoodEstimated Value: $116,000 - $227,000
About This Home
This home is located at 527 Denny St, High Point, NC 27262 and is currently estimated at $156,609, approximately $102 per square foot. 527 Denny St is a home located in Guilford County with nearby schools including Northwood Elementary School, Ferndale Middle School, and High Point Central High School.
Ownership History
We collect this data history from publicly available records. To have your information removed, we recommend requesting removal directly through your county’s website.
Purchase Details
Purchase Details
Purchase Details
Purchase Details
Purchase Details
Home Financials for this Owner
Home Financials are based on the most recent Mortgage that was taken out on this home.Purchase Details
Home Financials for this Owner
Home Financials are based on the most recent Mortgage that was taken out on this home.Purchase Details
Purchase Details
Home Values in the Area
Average Home Value in this Area
Purchase History
We collect this data history from publicly available records. To have your information removed, we recommend requesting removal directly through your county’s website.
| Date | Buyer | Sale Price | Title Company |
|---|---|---|---|
| $650,000 | None Listed On Document | ||
| $11,000 | None Available | ||
| $52,000 | None Available | ||
| -- | None Available | ||
| -- | None Available | ||
| -- | None Available | ||
| -- | None Available | ||
| $48,761 | -- |
Mortgage History
We collect this data history from publicly available records. To have your information removed, we recommend requesting removal directly through your county’s website.
| Date | Status | Borrower | Loan Amount |
|---|---|---|---|
| Previous Owner | $46,500 |
Tax History
We collect this data history from publicly available records. To have your information removed, we recommend requesting removal directly through your county’s website.
| Year | Tax Paid | Tax Assessment Tax Assessment Total Assessment is a certain percentage of the fair market value that is determined by local assessors to be the total taxable value of land and additions on the property. | Land | Improvement |
|---|---|---|---|---|
| 2025 | $962 | $69,800 | $10,000 | $59,800 |
| 2024 | $962 | $69,800 | $10,000 | $59,800 |
| 2023 | $962 | $69,800 | $10,000 | $59,800 |
| 2022 | $941 | $69,800 | $10,000 | $59,800 |
| 2021 | $620 | $45,000 | $10,000 | $35,000 |
| 2020 | $620 | $45,000 | $10,000 | $35,000 |
| 2019 | $620 | $45,000 | $0 | $0 |
| 2018 | $617 | $45,000 | $0 | $0 |
| 2017 | $620 | $45,000 | $0 | $0 |
| 2016 | $597 | $42,600 | $0 | $0 |
| 2015 | $601 | $42,600 | $0 | $0 |
| 2014 | $611 | $42,600 | $0 | $0 |
Map
- 504 4th St
- 323 4th St
- 719 Forrest St
- 721 Forrest St
- 419 Hobson St
- 411 Hobson St
- 220 Woodrow Ave
- 219 Woodrow Ave
- 528 E Farriss Ave
- 531 N Hamilton St Unit L
- 844 Willow Place
- 321 Louise Ave
- 1011 N Hamilton St
- 1207 Day Place
- 934 Forrest St
- 208 Underhill St
- 1102 Johnson St
- 608 E Lexington Ave
- 210 W Parkway Ave
- 304 W Ray Ave
Ask me questions while you tour the home.