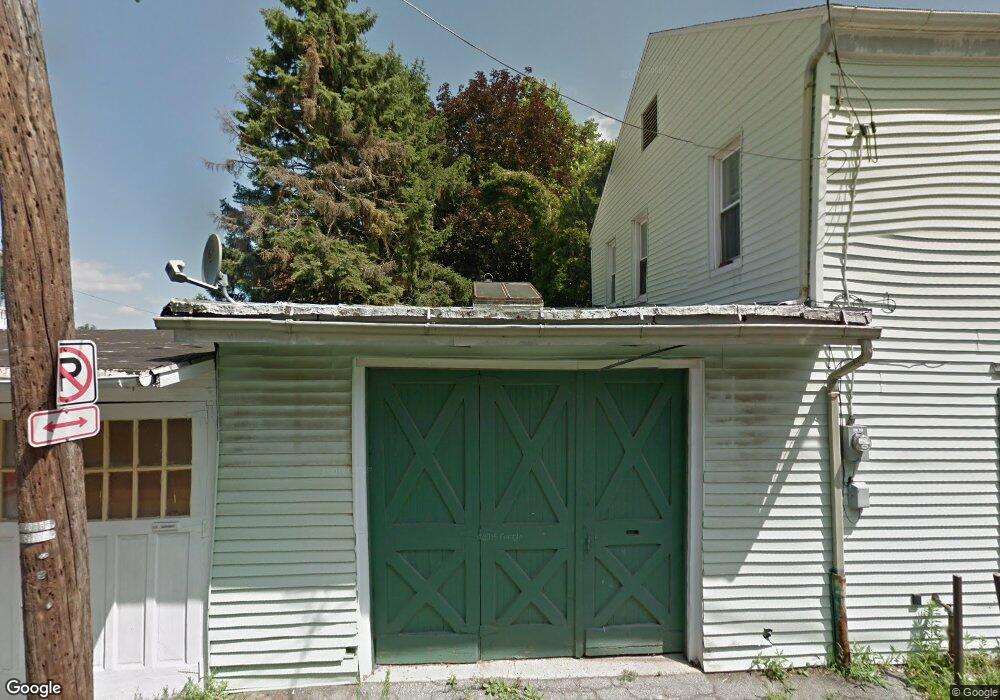
527 E Grant St Lancaster, PA 17602
East Side NeighborhoodEstimated Value: $200,000 - $233,000
3
Beds
1
Bath
1,120
Sq Ft
$198/Sq Ft
Est. Value
About This Home
This home is located at 527 E Grant St, Lancaster, PA 17602 and is currently estimated at $221,851, approximately $198 per square foot. 527 E Grant St is a home located in Lancaster County with nearby schools including Wickersham Elementary School, Burrowes Elementary School, and Lincoln Middle School.
Ownership History
Date
Name
Owned For
Owner Type
Purchase Details
Closed on
Dec 8, 2021
Sold by
Sourbeer Richard T and Sourbeer Denna J
Bought by
Bross Marley Kathleen and Calixto Ma Victoria
Current Estimated Value
Home Financials for this Owner
Home Financials are based on the most recent Mortgage that was taken out on this home.
Original Mortgage
$157,500
Outstanding Balance
$142,892
Interest Rate
2.75%
Mortgage Type
New Conventional
Estimated Equity
$78,959
Create a Home Valuation Report for This Property
The Home Valuation Report is an in-depth analysis detailing your home's value as well as a comparison with similar homes in the area
Home Values in the Area
Average Home Value in this Area
Purchase History
| Date | Buyer | Sale Price | Title Company |
|---|---|---|---|
| Bross Marley Kathleen | $175,000 | None Available |
Source: Public Records
Mortgage History
| Date | Status | Borrower | Loan Amount |
|---|---|---|---|
| Open | Bross Marley Kathleen | $157,500 |
Source: Public Records
Tax History
| Year | Tax Paid | Tax Assessment Tax Assessment Total Assessment is a certain percentage of the fair market value that is determined by local assessors to be the total taxable value of land and additions on the property. | Land | Improvement |
|---|---|---|---|---|
| 2025 | $2,323 | $58,700 | $22,200 | $36,500 |
| 2024 | $2,323 | $58,700 | $22,200 | $36,500 |
| 2023 | $2,284 | $58,700 | $22,200 | $36,500 |
| 2022 | $2,189 | $58,700 | $22,200 | $36,500 |
| 2021 | $2,142 | $58,700 | $22,200 | $36,500 |
| 2020 | $2,142 | $58,700 | $22,200 | $36,500 |
| 2019 | $2,110 | $58,700 | $22,200 | $36,500 |
| 2018 | $2,458 | $58,700 | $22,200 | $36,500 |
| 2017 | $2,274 | $49,500 | $16,400 | $33,100 |
| 2016 | $2,253 | $49,500 | $16,400 | $33,100 |
| 2015 | $879 | $49,500 | $16,400 | $33,100 |
| 2014 | $1,966 | $49,500 | $16,400 | $33,100 |
Source: Public Records
Map
Nearby Homes
- 16 S Ann St
- 53 S Marshall St
- 623 E Chestnut St
- 353 E Orange St
- 340 E Orange St
- 350 E Chestnut St
- 43 Green St
- 227 S Ann St
- 819 E Marion St
- 717 E Walnut St
- 627 E Madison St
- 247 N Shippen St Unit 411
- 312 N Reservoir St
- 309 N Reservoir St
- 319 N Reservoir St
- 911 E King St
- 561 S Lime St
- 530 S Lime St
- 145 E King St Unit 401
- 218 E Madison St
- 529 E Grant St
- 531 E Grant St
- 521 & 523 E Grant St
- 521 E Grant St
- 524 E Grant St
- 519 E Grant St
- 534 E Grant St
- 528 E Orange St
- 525 E King St
- 526 E Orange St
- 523 E King St
- 523 E King St Unit 2
- 524 E Orange St
- 530 E Orange St
- 529 E King St
- 532 E Orange St
- 520 E Orange St
- 518 E Orange St
- 28 N Marshall St
- 32 N Marshall St
Your Personal Tour Guide
Ask me questions while you tour the home.