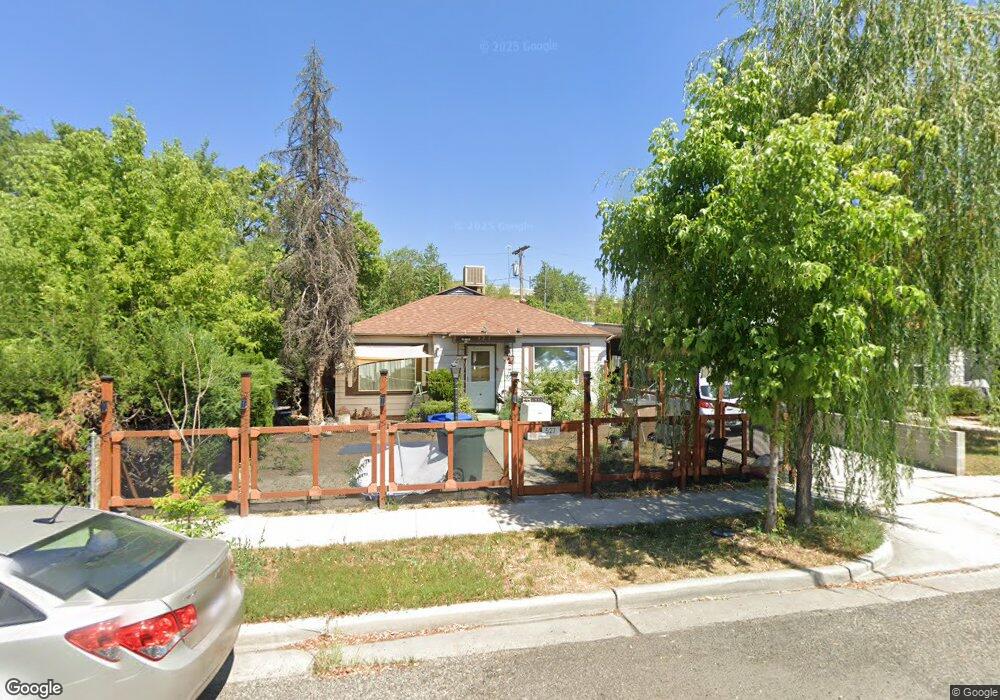
527 Jeremy St Salt Lake City, UT 84104
Poplar Grove NeighborhoodEstimated Value: $365,957 - $406,000
2
Beds
1
Bath
1,258
Sq Ft
$312/Sq Ft
Est. Value
About This Home
This home is located at 527 Jeremy St, Salt Lake City, UT 84104 and is currently estimated at $392,239, approximately $311 per square foot. 527 Jeremy St is a home located in Salt Lake County with nearby schools including Franklin Elementary School, East High School, and Salt Lake Arts Academy.
Ownership History
Date
Name
Owned For
Owner Type
Purchase Details
Closed on
Mar 29, 2021
Sold by
Andrade Rocio and Estate Of David R Andrade
Bought by
Andrade Rocio and Lopez Christian Martin
Current Estimated Value
Purchase Details
Closed on
Nov 22, 2010
Sold by
Connors Raymond and Connors Michael
Bought by
Andrade David R
Home Financials for this Owner
Home Financials are based on the most recent Mortgage that was taken out on this home.
Original Mortgage
$117,932
Outstanding Balance
$80,269
Interest Rate
4.9%
Mortgage Type
FHA
Estimated Equity
$311,970
Create a Home Valuation Report for This Property
The Home Valuation Report is an in-depth analysis detailing your home's value as well as a comparison with similar homes in the area
Home Values in the Area
Average Home Value in this Area
Purchase History
| Date | Buyer | Sale Price | Title Company |
|---|---|---|---|
| Andrade Rocio | -- | None Available | |
| Andrade David R | -- | Atlas Title Murray |
Source: Public Records
Mortgage History
| Date | Status | Borrower | Loan Amount |
|---|---|---|---|
| Open | Andrade David R | $117,932 | |
| Closed | Andrade David R | $5,900 |
Source: Public Records
Tax History Compared to Growth
Tax History
| Year | Tax Paid | Tax Assessment Tax Assessment Total Assessment is a certain percentage of the fair market value that is determined by local assessors to be the total taxable value of land and additions on the property. | Land | Improvement |
|---|---|---|---|---|
| 2025 | $1,247 | $268,700 | $77,000 | $191,700 |
| 2024 | $1,247 | $238,000 | $72,900 | $165,100 |
| 2023 | $1,169 | $215,000 | $70,100 | $144,900 |
| 2022 | $0 | $216,800 | $68,700 | $148,100 |
| 2021 | $1,093 | $170,800 | $52,000 | $118,800 |
| 2020 | $1,070 | $159,100 | $46,500 | $112,600 |
| 2019 | $1,066 | $149,200 | $46,500 | $102,700 |
| 2018 | $885 | $120,600 | $34,200 | $86,400 |
| 2017 | $904 | $115,400 | $34,200 | $81,200 |
| 2016 | $926 | $112,200 | $28,800 | $83,400 |
| 2015 | $614 | $70,500 | $29,200 | $41,300 |
| 2014 | $548 | $62,400 | $27,900 | $34,500 |
Source: Public Records
Map
Nearby Homes