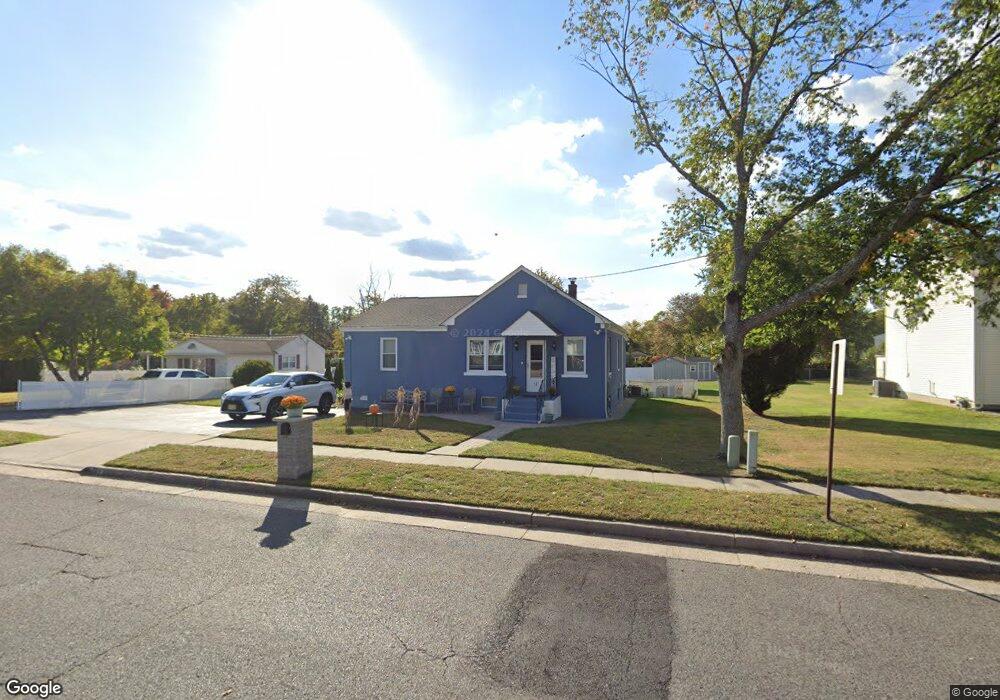
527 Line Rd Matawan, NJ 07747
Estimated Value: $524,711 - $588,000
4
Beds
1
Bath
1,241
Sq Ft
$440/Sq Ft
Est. Value
About This Home
This home is located at 527 Line Rd, Matawan, NJ 07747 and is currently estimated at $545,928, approximately $439 per square foot. 527 Line Rd is a home located in Monmouth County with nearby schools including Matawan Reg High School, St Benedict School, and St. Joseph Elementary School.
Ownership History
Date
Name
Owned For
Owner Type
Purchase Details
Closed on
Jul 12, 2006
Sold by
Jesus Carlos Alex
Bought by
Jesus Carlos Alex and Espada Denise V
Current Estimated Value
Home Financials for this Owner
Home Financials are based on the most recent Mortgage that was taken out on this home.
Original Mortgage
$288,750
Outstanding Balance
$197,480
Interest Rate
9.6%
Mortgage Type
Adjustable Rate Mortgage/ARM
Estimated Equity
$348,448
Purchase Details
Closed on
Sep 14, 2004
Sold by
Dougherty William
Bought by
Jesus Carlos
Home Financials for this Owner
Home Financials are based on the most recent Mortgage that was taken out on this home.
Original Mortgage
$258,875
Interest Rate
5.81%
Create a Home Valuation Report for This Property
The Home Valuation Report is an in-depth analysis detailing your home's value as well as a comparison with similar homes in the area
Home Values in the Area
Average Home Value in this Area
Purchase History
| Date | Buyer | Sale Price | Title Company |
|---|---|---|---|
| Jesus Carlos Alex | -- | -- | |
| Jesus Carlos | $272,500 | -- |
Source: Public Records
Mortgage History
| Date | Status | Borrower | Loan Amount |
|---|---|---|---|
| Open | Jesus Carlos Alex | $288,750 | |
| Previous Owner | Jesus Carlos | $258,875 |
Source: Public Records
Tax History Compared to Growth
Tax History
| Year | Tax Paid | Tax Assessment Tax Assessment Total Assessment is a certain percentage of the fair market value that is determined by local assessors to be the total taxable value of land and additions on the property. | Land | Improvement |
|---|---|---|---|---|
| 2025 | $7,736 | $426,900 | $302,800 | $124,100 |
| 2024 | $7,551 | $382,800 | $261,000 | $121,800 |
| 2023 | $7,551 | $353,000 | $234,000 | $119,000 |
| 2022 | $6,522 | $306,900 | $194,100 | $112,800 |
| 2021 | $6,522 | $241,300 | $141,000 | $100,300 |
| 2020 | $7,781 | $286,700 | $188,700 | $98,000 |
| 2019 | $7,756 | $277,600 | $180,100 | $97,500 |
| 2018 | $7,547 | $270,800 | $177,900 | $92,900 |
| 2017 | $7,439 | $270,700 | $180,600 | $90,100 |
| 2016 | $6,877 | $261,200 | $173,400 | $87,800 |
| 2015 | $6,858 | $250,000 | $164,400 | $85,600 |
| 2014 | $6,491 | $241,300 | $156,300 | $85,000 |
Source: Public Records
Map
Nearby Homes