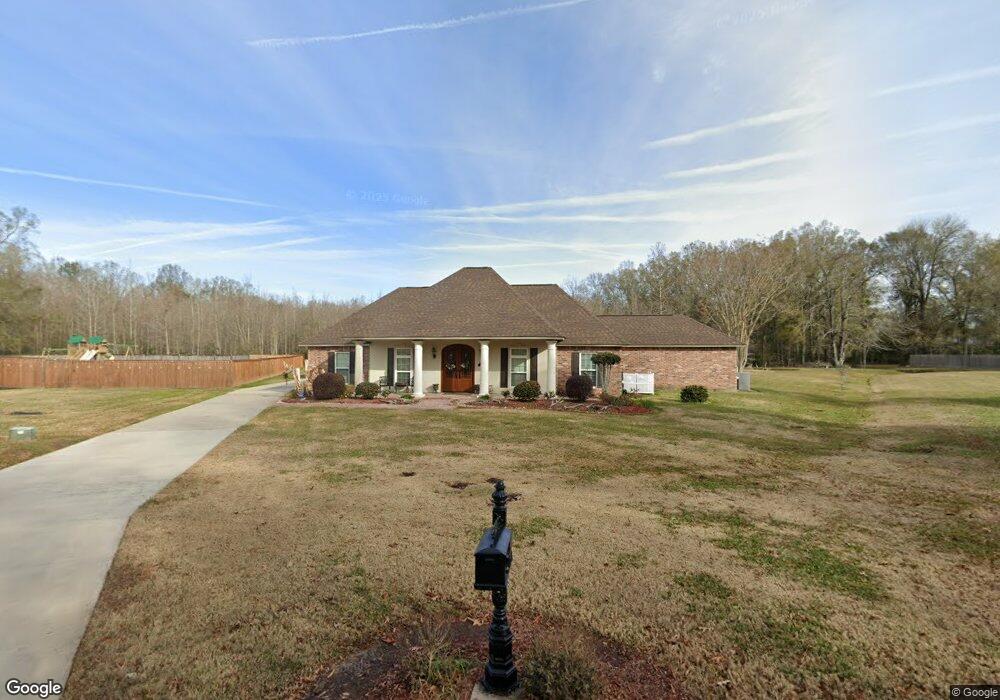
527 Myrtle Grove Rd Jackson, LA 70748
Estimated Value: $348,926 - $481,000
4
Beds
3
Baths
2,352
Sq Ft
$181/Sq Ft
Est. Value
About This Home
This home is located at 527 Myrtle Grove Rd, Jackson, LA 70748 and is currently estimated at $425,982, approximately $181 per square foot. 527 Myrtle Grove Rd is a home located in East Feliciana Parish with nearby schools including East Feliciana High School.
Ownership History
Date
Name
Owned For
Owner Type
Purchase Details
Closed on
May 29, 2018
Sold by
Amacker Michael Kemp and Amacker Jacquita Jeanise
Bought by
Amacker Jacquita Jeanise
Current Estimated Value
Purchase Details
Closed on
Feb 23, 2011
Sold by
Moore James Henry and Moore Mary Lisa
Bought by
Amacker Michael Kemp
Home Financials for this Owner
Home Financials are based on the most recent Mortgage that was taken out on this home.
Original Mortgage
$232,000
Outstanding Balance
$158,148
Interest Rate
4.7%
Mortgage Type
New Conventional
Estimated Equity
$267,834
Purchase Details
Closed on
Mar 31, 2006
Sold by
Tuggle Anthony Ivan and Tuggle Teri Nicholas
Bought by
Moore James Henry and Moore Mary Lisa
Home Financials for this Owner
Home Financials are based on the most recent Mortgage that was taken out on this home.
Original Mortgage
$223,200
Interest Rate
6.24%
Mortgage Type
New Conventional
Create a Home Valuation Report for This Property
The Home Valuation Report is an in-depth analysis detailing your home's value as well as a comparison with similar homes in the area
Home Values in the Area
Average Home Value in this Area
Purchase History
| Date | Buyer | Sale Price | Title Company |
|---|---|---|---|
| Amacker Jacquita Jeanise | -- | -- | |
| Amacker Michael Kemp | $290,000 | -- | |
| Moore James Henry | $248,000 | -- |
Source: Public Records
Mortgage History
| Date | Status | Borrower | Loan Amount |
|---|---|---|---|
| Open | Amacker Michael Kemp | $232,000 | |
| Previous Owner | Moore James Henry | $223,200 |
Source: Public Records
Tax History Compared to Growth
Tax History
| Year | Tax Paid | Tax Assessment Tax Assessment Total Assessment is a certain percentage of the fair market value that is determined by local assessors to be the total taxable value of land and additions on the property. | Land | Improvement |
|---|---|---|---|---|
| 2024 | $1,363 | $27,690 | $2,930 | $24,760 |
| 2023 | $1,363 | $27,690 | $2,930 | $24,760 |
| 2022 | $1,363 | $27,690 | $2,930 | $24,760 |
| 2021 | $1,363 | $27,690 | $2,930 | $24,760 |
| 2020 | $1,358 | $27,690 | $2,930 | $24,760 |
| 2019 | $1,363 | $27,690 | $2,930 | $24,760 |
| 2018 | $1,363 | $27,690 | $2,930 | $24,760 |
| 2017 | $1,363 | $24,760 | $0 | $24,760 |
| 2015 | $1,357 | $27,550 | $2,790 | $24,760 |
| 2014 | $1,357 | $27,550 | $2,790 | $24,760 |
| 2013 | $1,361 | $27,550 | $2,790 | $24,760 |
Source: Public Records
Map
Nearby Homes
- 885 Feliciana Crossing
- Lot 9 Ruth Ave
- Lot 19 Duncan Ave
- Lot 2 Ruth Ave
- Lot 44 Duncan Ave
- Lot 11 Duncan Ave
- 849 Dougherty Ln
- 0 Tbd La Hwy 964
- LOT 1 Highland Meadows Dr
- 23434 Portwood Ln
- TBD Plains-Port Hudson Rd
- 23324 Portwood Ln
- 23123 Sunnyside Ln
- TBD La Hwy 68
- 22747 Beaver Cove Ct
- 22330 Fairway View Dr
- 22658 Sutter Ln
- 22259 Sand Trap Way
- 25247 Shane Ct
- Lot 1-B Talmadge Dr
- 527 Myrtle Grove Rd
- 524 Myrtle Grove Rd
- 519 Myrtle Grove Rd
- 524 Myrtle Grove Rd
- 519 Myrtle Grove Ct
- 0 Myrtle Grove Ct
- 516 Myrtle Grove Rd
- 904 Feliciana Crossing
- 920 Feliciana Crossing
- 944 Feliciana Crossing
- 541 Clover Ridge Dr
- 531 Clover Ridge Dr
- LOT 5 Feliciana Crossing Dr
- LOT 15 Feliciana Crossing Dr
- 23 Feliciana Crossing Dr
- 939 Feliciana Crossing Dr
- 971 Feliciana Crossing Dr
- 955 Feliciana Crossing Dr
- L Feliciana Crossing Dr Unit OT 3
- L Feliciana Crossing Dr Unit OT 11