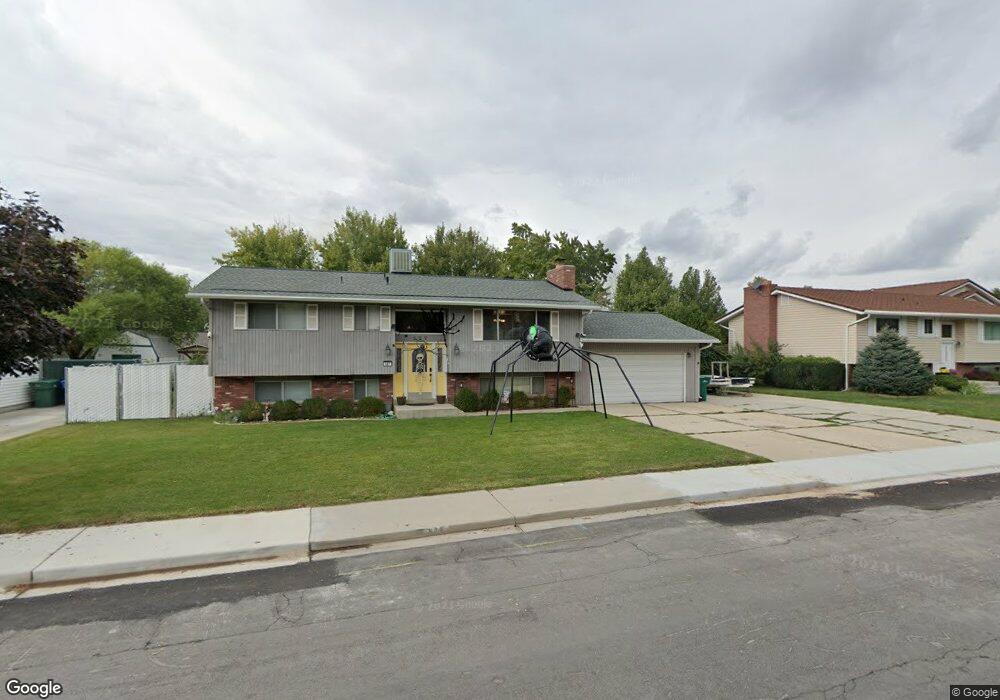
527 N 1200 E Orem, UT 84097
Orchard South NeighborhoodEstimated Value: $528,000 - $611,000
5
Beds
2
Baths
2,088
Sq Ft
$268/Sq Ft
Est. Value
About This Home
This home is located at 527 N 1200 E, Orem, UT 84097 and is currently estimated at $559,176, approximately $267 per square foot. 527 N 1200 E is a home located in Utah County with nearby schools including Foothill Elementary School, Canyon View Junior High School, and Orem High School.
Ownership History
Date
Name
Owned For
Owner Type
Purchase Details
Closed on
Oct 21, 2014
Sold by
The Neal Joseph Henry And Cindy R Henry
Bought by
Patterson Jason and Patterson Heather
Current Estimated Value
Home Financials for this Owner
Home Financials are based on the most recent Mortgage that was taken out on this home.
Original Mortgage
$188,550
Outstanding Balance
$144,922
Interest Rate
4.17%
Mortgage Type
New Conventional
Estimated Equity
$414,254
Purchase Details
Closed on
May 12, 2010
Sold by
Henry Neal Joseph and Henry Cindy R
Bought by
Henry Neal Joseph and Henry Cindy R
Purchase Details
Closed on
Oct 27, 1998
Sold by
Henry Neal J and Henry Cindy R
Bought by
Henry Neal Joseph and Henry Cindy R
Home Financials for this Owner
Home Financials are based on the most recent Mortgage that was taken out on this home.
Original Mortgage
$65,500
Interest Rate
6.6%
Create a Home Valuation Report for This Property
The Home Valuation Report is an in-depth analysis detailing your home's value as well as a comparison with similar homes in the area
Home Values in the Area
Average Home Value in this Area
Purchase History
| Date | Buyer | Sale Price | Title Company |
|---|---|---|---|
| Patterson Jason | -- | Backman Title Services Ltd | |
| Henry Neal Joseph | -- | None Available | |
| Henry Neal Joseph | -- | First American Title Co |
Source: Public Records
Mortgage History
| Date | Status | Borrower | Loan Amount |
|---|---|---|---|
| Open | Patterson Jason | $188,550 | |
| Previous Owner | Henry Neal Joseph | $65,500 |
Source: Public Records
Tax History
| Year | Tax Paid | Tax Assessment Tax Assessment Total Assessment is a certain percentage of the fair market value that is determined by local assessors to be the total taxable value of land and additions on the property. | Land | Improvement |
|---|---|---|---|---|
| 2025 | $2,175 | $274,065 | -- | -- |
| 2024 | $2,175 | $265,925 | $0 | $0 |
| 2023 | $2,008 | $263,835 | $0 | $0 |
| 2022 | $2,041 | $259,875 | $0 | $0 |
| 2021 | $1,708 | $329,400 | $150,800 | $178,600 |
| 2020 | $1,560 | $295,700 | $120,600 | $175,100 |
| 2019 | $1,421 | $280,100 | $110,000 | $170,100 |
| 2018 | $1,385 | $260,900 | $106,400 | $154,500 |
| 2017 | $1,316 | $132,715 | $0 | $0 |
| 2016 | $1,365 | $126,995 | $0 | $0 |
| 2015 | $1,291 | $113,575 | $0 | $0 |
| 2014 | $1,136 | $99,440 | $0 | $0 |
Source: Public Records
Map
Nearby Homes
- 566 N Bella Vista Dr
- 551 N 900 E
- 80 N 1200 E
- 5005 N Edgewood Dr Unit 310
- 181 N 800 E
- 150 N 750 E
- 85 S 1000 E
- 112 S 1000 E
- 471 E 700 N
- 221 E 4735 N
- 976 N 560 E
- 285 Three Fountains Dr
- 337 Birchwood Dr
- 710 E 1280 N
- 4380 Stone Creek Ln
- 362 E 800 N Unit 1
- 332 E 290 N
- 311 N 330 E
- 307 E Elmwood Dr
- 305 E Elmwood Dr
Your Personal Tour Guide
Ask me questions while you tour the home.