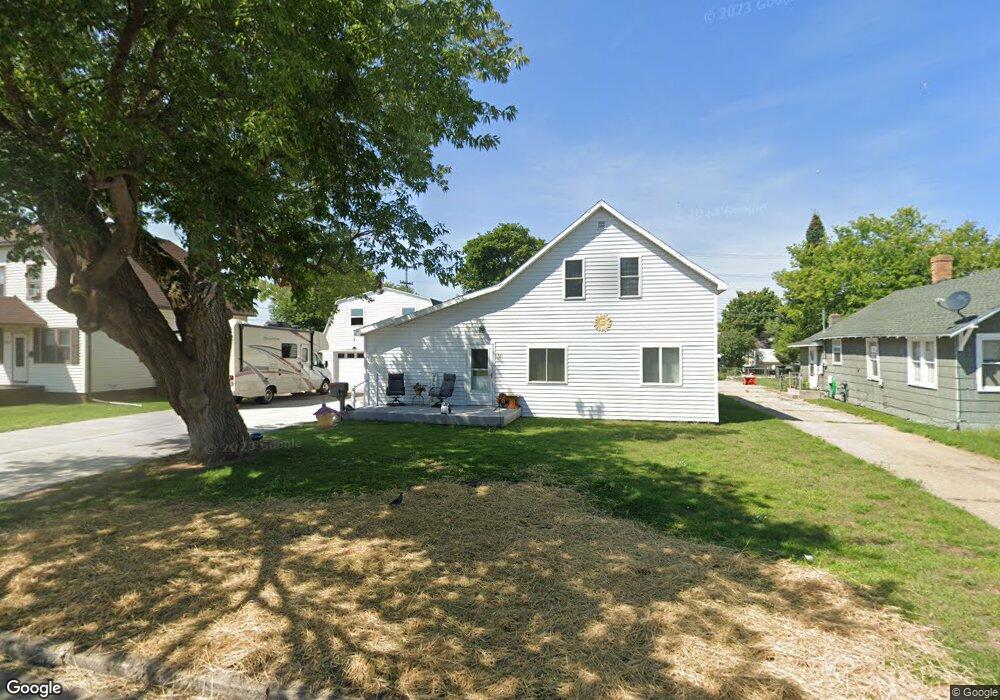
527 N 20th St Escanaba, MI 49829
Estimated Value: $143,000 - $176,467
2
Beds
2
Baths
936
Sq Ft
$168/Sq Ft
Est. Value
About This Home
This home is located at 527 N 20th St, Escanaba, MI 49829 and is currently estimated at $156,867, approximately $167 per square foot. 527 N 20th St is a home located in Delta County with nearby schools including Escanaba Jr./Sr. High School, Holy Name Catholic School, and Escanaba Sda School.
Ownership History
Date
Name
Owned For
Owner Type
Purchase Details
Closed on
Mar 12, 2003
Bought by
Lanaville Mose K and Lanaville Lisa A
Current Estimated Value
Purchase Details
Closed on
Oct 11, 2002
Sold by
Lanaville Mose K and Lanaville Lisa A
Bought by
U S Dept Of Ag
Purchase Details
Closed on
Sep 11, 1996
Sold by
Swed Leonard J and Swed Marion
Bought by
Lanaville Mose K and Lanaville Lisa A
Purchase Details
Closed on
Sep 28, 1979
Sold by
Kasen Edith
Bought by
Swed Daniel and Swed Charlene
Create a Home Valuation Report for This Property
The Home Valuation Report is an in-depth analysis detailing your home's value as well as a comparison with similar homes in the area
Home Values in the Area
Average Home Value in this Area
Purchase History
| Date | Buyer | Sale Price | Title Company |
|---|---|---|---|
| Lanaville Mose K | $28,000 | -- | |
| U S Dept Of Ag | $27,200 | -- | |
| Lanaville Mose K | -- | -- | |
| Swed Daniel | $5,000 | -- |
Source: Public Records
Tax History Compared to Growth
Tax History
| Year | Tax Paid | Tax Assessment Tax Assessment Total Assessment is a certain percentage of the fair market value that is determined by local assessors to be the total taxable value of land and additions on the property. | Land | Improvement |
|---|---|---|---|---|
| 2025 | $2,058 | $74,500 | $0 | $0 |
| 2024 | $1,564 | $64,700 | $0 | $0 |
| 2023 | $1,491 | $52,300 | $0 | $0 |
| 2022 | $1,903 | $44,900 | $0 | $0 |
| 2021 | $1,984 | $47,000 | $0 | $0 |
| 2020 | $2,021 | $47,800 | $0 | $0 |
| 2019 | $1,957 | $46,800 | $0 | $0 |
| 2018 | $1,969 | $47,200 | $0 | $0 |
| 2017 | $1,438 | $46,119 | $0 | $0 |
| 2016 | $1,941 | $46,957 | $0 | $0 |
| 2014 | $1,437 | $47,580 | $0 | $0 |
| 2013 | $1,437 | $46,987 | $0 | $0 |
Source: Public Records
Map
Nearby Homes