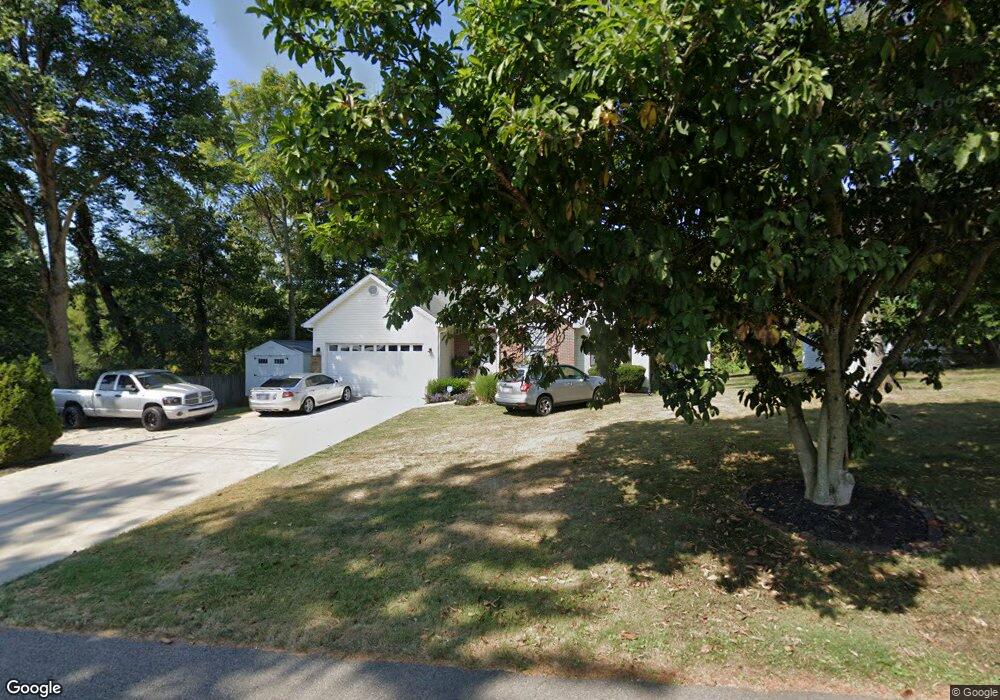
527 N Basil St Baltimore, OH 43105
Estimated Value: $297,000 - $420,000
3
Beds
2
Baths
1,691
Sq Ft
$209/Sq Ft
Est. Value
About This Home
This home is located at 527 N Basil St, Baltimore, OH 43105 and is currently estimated at $354,005, approximately $209 per square foot. 527 N Basil St is a home located in Fairfield County with nearby schools including Liberty Union Elementary School, Liberty Union Middle School, and Liberty Union High School.
Ownership History
Date
Name
Owned For
Owner Type
Purchase Details
Closed on
Oct 12, 2005
Sold by
Wells Fargo Bank Minnesota Na
Bought by
Deskins Jessica M and Kilpatrick Paul Edward Ian
Current Estimated Value
Home Financials for this Owner
Home Financials are based on the most recent Mortgage that was taken out on this home.
Original Mortgage
$110,300
Outstanding Balance
$57,731
Interest Rate
5.8%
Mortgage Type
Purchase Money Mortgage
Estimated Equity
$296,274
Purchase Details
Closed on
May 10, 2005
Sold by
Cooper Stephen D and Cooper Terry
Bought by
Wells Fargo Bank Minnesota Na
Purchase Details
Closed on
Apr 11, 2003
Sold by
Dunlap Scott C
Bought by
Cooper Stephen D and Cooper Terry
Home Financials for this Owner
Home Financials are based on the most recent Mortgage that was taken out on this home.
Original Mortgage
$127,920
Interest Rate
7.37%
Mortgage Type
Purchase Money Mortgage
Purchase Details
Closed on
Jul 25, 2000
Sold by
Dunlap Myrtle M
Bought by
Bellagio Builders Inc
Create a Home Valuation Report for This Property
The Home Valuation Report is an in-depth analysis detailing your home's value as well as a comparison with similar homes in the area
Home Values in the Area
Average Home Value in this Area
Purchase History
| Date | Buyer | Sale Price | Title Company |
|---|---|---|---|
| Deskins Jessica M | $137,900 | Magee Title Agency | |
| Wells Fargo Bank Minnesota Na | $106,000 | -- | |
| Cooper Stephen D | $159,900 | Chicago Title | |
| Bellagio Builders Inc | $30,000 | -- |
Source: Public Records
Mortgage History
| Date | Status | Borrower | Loan Amount |
|---|---|---|---|
| Open | Deskins Jessica M | $110,300 | |
| Previous Owner | Cooper Stephen D | $127,920 |
Source: Public Records
Tax History
| Year | Tax Paid | Tax Assessment Tax Assessment Total Assessment is a certain percentage of the fair market value that is determined by local assessors to be the total taxable value of land and additions on the property. | Land | Improvement |
|---|---|---|---|---|
| 2025 | $7,717 | $121,600 | $21,410 | $100,190 |
| 2024 | $7,717 | $102,800 | $15,540 | $87,260 |
| 2023 | $3,943 | $102,800 | $15,540 | $87,260 |
| 2022 | $3,911 | $102,800 | $15,540 | $87,260 |
| 2021 | $3,171 | $75,570 | $14,080 | $61,490 |
| 2020 | $3,244 | $75,570 | $14,080 | $61,490 |
| 2019 | $3,297 | $75,570 | $14,080 | $61,490 |
| 2018 | $2,972 | $63,870 | $14,080 | $49,790 |
| 2017 | $2,987 | $62,450 | $14,080 | $48,370 |
| 2016 | $2,944 | $62,450 | $14,080 | $48,370 |
| 2015 | $2,716 | $60,330 | $14,080 | $46,250 |
| 2014 | $2,605 | $60,330 | $14,080 | $46,250 |
| 2013 | $2,605 | $60,330 | $14,080 | $46,250 |
Source: Public Records
Map
Nearby Homes
- 0 Basil Rd NW Unit 226003110
- 201 N Liberty St
- 116 S High St
- 727 W Washington St
- 0 S Company St Unit Lot 2 225029545
- 0 S Company St Unit Lot 1 225029543
- 7836 Basil Rd NW
- 1455 Giesy Rd NW
- 403 S Walnut St
- 407 S Main St
- 113 S Park Dr
- 601 S Main St
- 0 Cherry Ln Unit 226008720
- 201 E Dorchester Dr
- 112 N Creekview Ct
- 220 N Wagner Ave
- 1813 Bickel Church Rd NW
- 445 Baltimore Somerset Rd NE
- 570 Baltimore Somerset Rd NE Unit Lot 1
- 0 Lancaster-Newark Rd NE Unit Lot A
- 527 Basil Rd NW
- 529 N Basil St
- 12848 Basil Rd NW
- 0 Basil Rd NW Unit 2701244
- 0 Basil Rd NW Unit 2617032
- 0 Basil Rd NW Unit 2447059
- 9500 Basil Rd NW
- 0 Basil Rd NW Unit 87111
- 12800 Basil Rd NW
- 0 Basil Rd NW Unit 61399
- 0 Basil Rd NW Unit 9823244
- 0 Basil Rd NW Unit 9718796
- 0 Basil Rd NW Unit 9716453
- 0 Basil Rd NW Unit Tract 2 224041604
- 0 Basil Rd NW Unit 224030195
- 0 Basil Rd NW Unit 223014090
- 0 Basil Rd NW Unit 2838158
- 0 Basil Rd NW Unit 221021279
- 0 Basil Rd NW Unit 221021272
- 0 Basil Rd NW Unit 220020395
Your Personal Tour Guide
Ask me questions while you tour the home.