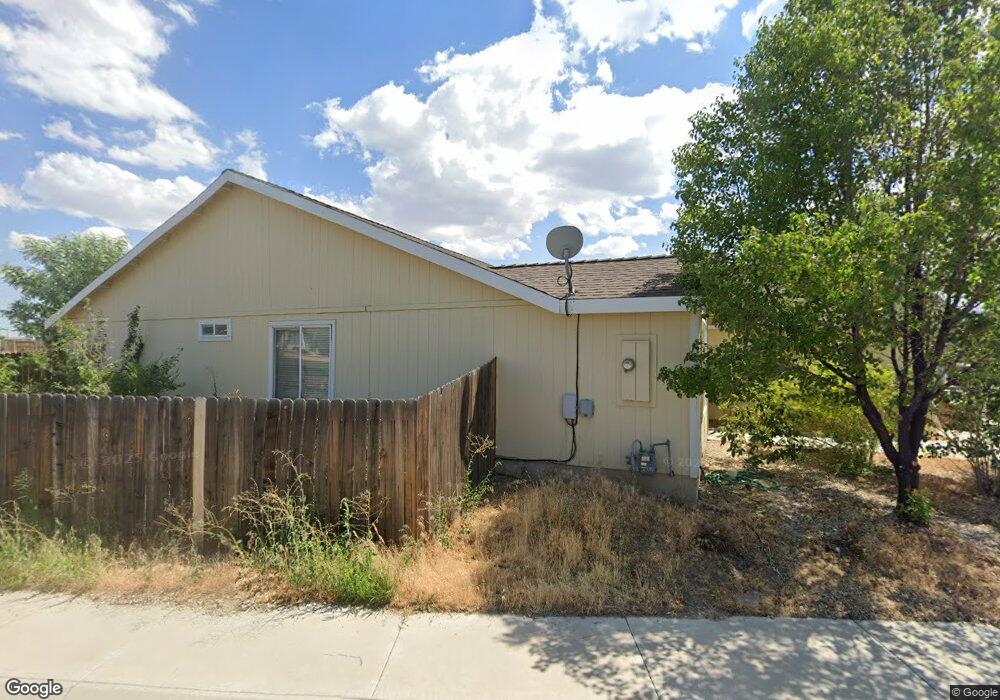
527 River Ranch Rd Fernley, NV 89408
Estimated Value: $417,000 - $423,000
4
Beds
2
Baths
2,212
Sq Ft
$190/Sq Ft
Est. Value
About This Home
This home is located at 527 River Ranch Rd, Fernley, NV 89408 and is currently estimated at $419,772, approximately $189 per square foot. 527 River Ranch Rd is a home located in Lyon County with nearby schools including East Valley Elementary School, Fernley Intermediate School, and Fernley High School.
Ownership History
Date
Name
Owned For
Owner Type
Purchase Details
Closed on
Apr 15, 2009
Sold by
Hsbc Bank Usa National Association
Bought by
Shattuck William
Current Estimated Value
Home Financials for this Owner
Home Financials are based on the most recent Mortgage that was taken out on this home.
Original Mortgage
$132,000
Outstanding Balance
$91,914
Interest Rate
5.02%
Mortgage Type
USDA
Estimated Equity
$327,858
Purchase Details
Closed on
Jul 14, 2008
Sold by
Villa Jerardo and Dopita Kristina
Bought by
Hsbc Bank Usa Na and Home Equity Loan Tr Series Ace 2005-He5
Purchase Details
Closed on
May 17, 2005
Sold by
Davidson Chandra T
Bought by
Villa Jerardo and Dopita Kristina
Home Financials for this Owner
Home Financials are based on the most recent Mortgage that was taken out on this home.
Original Mortgage
$227,920
Interest Rate
5.87%
Mortgage Type
Adjustable Rate Mortgage/ARM
Create a Home Valuation Report for This Property
The Home Valuation Report is an in-depth analysis detailing your home's value as well as a comparison with similar homes in the area
Home Values in the Area
Average Home Value in this Area
Purchase History
| Date | Buyer | Sale Price | Title Company |
|---|---|---|---|
| Shattuck William | $130,000 | Ticor Title Of Nevada Inc | |
| Hsbc Bank Usa Na | $139,750 | Lsi | |
| Villa Jerardo | $284,900 | Title Services & Escrow Co |
Source: Public Records
Mortgage History
| Date | Status | Borrower | Loan Amount |
|---|---|---|---|
| Open | Shattuck William | $132,000 | |
| Previous Owner | Villa Jerardo | $227,920 |
Source: Public Records
Tax History Compared to Growth
Tax History
| Year | Tax Paid | Tax Assessment Tax Assessment Total Assessment is a certain percentage of the fair market value that is determined by local assessors to be the total taxable value of land and additions on the property. | Land | Improvement |
|---|---|---|---|---|
| 2025 | $1,747 | $123,171 | $43,750 | $79,421 |
| 2024 | $2,106 | $123,619 | $43,750 | $79,869 |
| 2023 | $2,106 | $118,633 | $0 | $0 |
| 2022 | $1,978 | $113,428 | $43,750 | $69,678 |
| 2021 | $1,957 | $102,568 | $34,650 | $67,918 |
| 2020 | $1,907 | $99,145 | $34,650 | $64,495 |
| 2019 | $1,880 | $93,581 | $31,500 | $62,081 |
| 2018 | $1,841 | $81,594 | $21,000 | $60,594 |
| 2017 | $1,832 | $73,698 | $13,130 | $60,568 |
| 2016 | $1,640 | $58,277 | $5,780 | $52,497 |
| 2015 | $1,675 | $45,497 | $5,780 | $39,717 |
| 2014 | $1,637 | $34,435 | $5,780 | $28,655 |
Source: Public Records
Map
Nearby Homes
- 863 Jennys Ln
- 870 Jennys Ln
- 1848 Fort Sutter Blvd Unit Lot 6
- 1844 Fort Sutter Blvd Unit Lot 5
- 675 Warren Way
- 698 Jenny's Ln
- 4531 Mifflin St Unit Lot 28
- Topaz Plan at Nevada Sky
- Tahoe Plan at Nevada Sky
- Washoe Plan at Nevada Sky
- 4520 Mifflin St Unit Lot 1
- 4535 Mifflin St Unit Lot 27
- 1494 Mountain Rose Dr
- 021 46103
- 357 Emigrant Way
- 4543 Mifflin St
- 4543 Mifflin St Unit Lot 25
- 1075 Browne Ln
- APN 021-191-08
- 1671 Vista Moon Ct
- 531 River Ranch Rd
- 526 River Ranch Rd
- 528 River Ranch Rd
- 524 River Ranch Rd
- 533 River Ranch Rd
- 530 River Ranch Rd
- 1546 Reese River Rd
- 532 River Ranch Rd
- 1544 Reese River Rd
- 1548 Reese River Rd
- 1542 Reese River Rd
- 1667 Round up Rd
- 523 River Ranch Rd
- 1665 Round up Rd
- 1550 Reese River Rd
- 534 River Ranch Rd
- 537 River Ranch Rd
- 1663 Round up Rd
- 1669 Round up Rd
- 1552 Reese River Rd