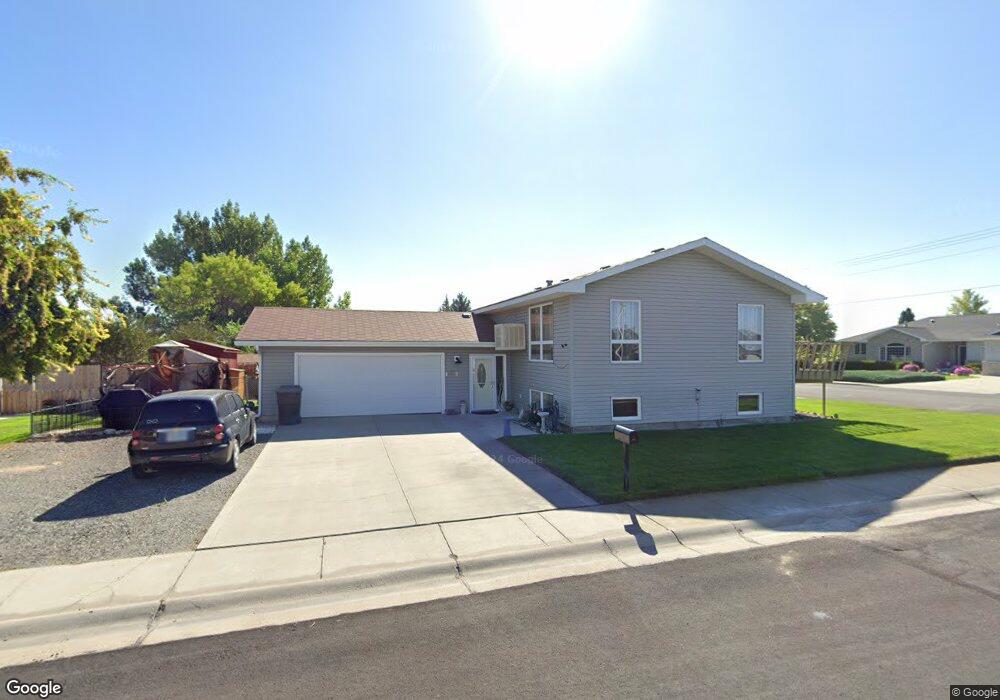
527 S Ingalls St Powell, WY 82435
Estimated Value: $342,000 - $370,000
3
Beds
2
Baths
1,146
Sq Ft
$312/Sq Ft
Est. Value
About This Home
This home is located at 527 S Ingalls St, Powell, WY 82435 and is currently estimated at $357,469, approximately $311 per square foot. 527 S Ingalls St is a home located in Park County with nearby schools including Southside Elementary School, Clark Elementary School, and Powell Middle School.
Ownership History
Date
Name
Owned For
Owner Type
Purchase Details
Closed on
Sep 14, 2007
Sold by
Ouellette Erich and Ouellette Beth
Bought by
Baker Rick D and Baker Lisa R
Current Estimated Value
Home Financials for this Owner
Home Financials are based on the most recent Mortgage that was taken out on this home.
Original Mortgage
$179,600
Outstanding Balance
$114,466
Interest Rate
6.7%
Mortgage Type
VA
Estimated Equity
$243,003
Purchase Details
Closed on
Jun 19, 2006
Sold by
Auge Bernard
Bought by
Quellette Erich
Purchase Details
Closed on
Mar 30, 2005
Sold by
Grauberger James D and Grauberger Brenda G
Bought by
Auge Bernard
Home Financials for this Owner
Home Financials are based on the most recent Mortgage that was taken out on this home.
Original Mortgage
$103,720
Interest Rate
6.99%
Mortgage Type
Adjustable Rate Mortgage/ARM
Create a Home Valuation Report for This Property
The Home Valuation Report is an in-depth analysis detailing your home's value as well as a comparison with similar homes in the area
Home Values in the Area
Average Home Value in this Area
Purchase History
| Date | Buyer | Sale Price | Title Company |
|---|---|---|---|
| Baker Rick D | -- | None Available | |
| Quellette Erich | -- | None Available | |
| Auge Bernard | -- | None Available |
Source: Public Records
Mortgage History
| Date | Status | Borrower | Loan Amount |
|---|---|---|---|
| Open | Baker Rick D | $179,600 | |
| Previous Owner | Auge Bernard | $103,720 |
Source: Public Records
Tax History Compared to Growth
Tax History
| Year | Tax Paid | Tax Assessment Tax Assessment Total Assessment is a certain percentage of the fair market value that is determined by local assessors to be the total taxable value of land and additions on the property. | Land | Improvement |
|---|---|---|---|---|
| 2025 | $1,883 | $24,848 | $3,210 | $21,638 |
| 2024 | $2,427 | $32,021 | $4,280 | $27,741 |
| 2023 | $2,288 | $30,608 | $3,934 | $26,674 |
| 2022 | $1,961 | $26,227 | $3,379 | $22,848 |
| 2021 | $1,647 | $21,737 | $3,379 | $18,358 |
| 2020 | $1,506 | $19,765 | $3,474 | $16,291 |
| 2019 | $1,466 | $19,157 | $3,474 | $15,683 |
| 2018 | $1,372 | $17,932 | $3,474 | $14,458 |
| 2017 | $1,412 | $18,516 | $3,331 | $15,185 |
| 2016 | $1,398 | $18,792 | $3,331 | $15,461 |
| 2015 | $1,296 | $17,417 | $2,856 | $14,561 |
| 2014 | -- | $17,162 | $2,856 | $14,306 |
Source: Public Records
Map
Nearby Homes
- 915 E Monroe St
- 523 S Ingalls St
- 914 Van Place
- 921 E Monroe St
- 837 E Monroe St
- 538 S Ingalls St
- 920 Van Place
- 910 E Monroe St
- 925 E Monroe St
- 840 E Monroe St
- 924 Van Place
- 827 E Monroe St
- 539 Hamilton Way
- 515 S Ingalls St
- 522 S Ingalls St
- 913 Van Place
- 531 Hamilton Way
- 531 Hamilton Way
- 929 E Monroe St
- 919 Van Place