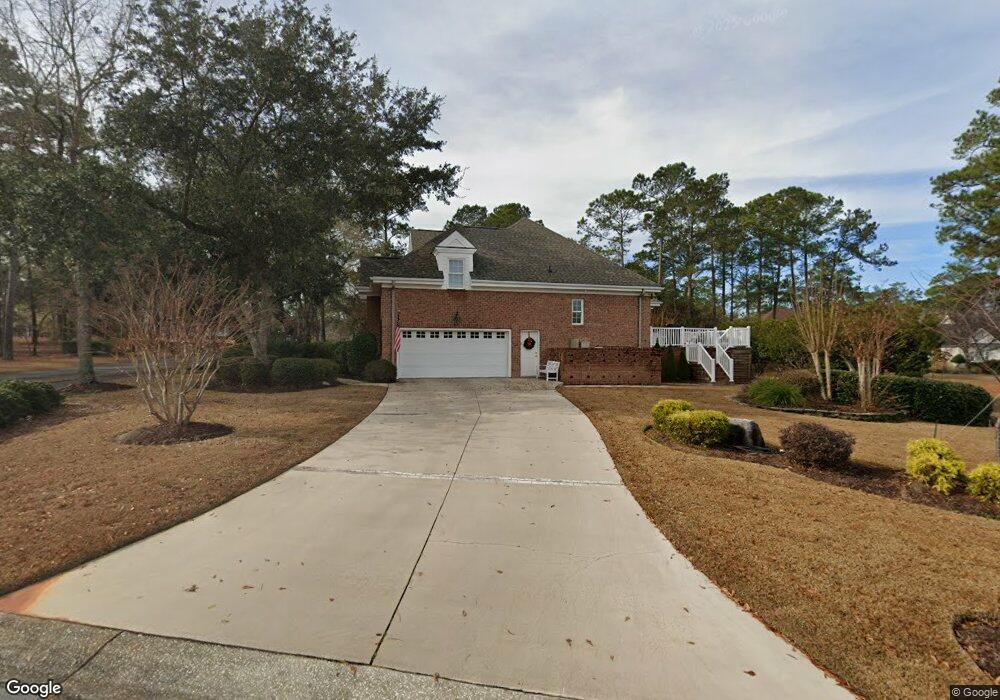
527 Stratton Place SW Ocean Isle Beach, NC 28469
Estimated Value: $731,618 - $859,000
3
Beds
4
Baths
3,069
Sq Ft
$267/Sq Ft
Est. Value
About This Home
This home is located at 527 Stratton Place SW, Ocean Isle Beach, NC 28469 and is currently estimated at $818,405, approximately $266 per square foot. 527 Stratton Place SW is a home located in Brunswick County with nearby schools including Union Elementary School, Shallotte Middle School, and West Brunswick High School.
Ownership History
Date
Name
Owned For
Owner Type
Purchase Details
Closed on
May 4, 2005
Sold by
Coastal Comunities At Ocean Ridge Planta
Bought by
Christiansen Glenn H and Christiansen Alice L
Current Estimated Value
Home Financials for this Owner
Home Financials are based on the most recent Mortgage that was taken out on this home.
Original Mortgage
$116,910
Outstanding Balance
$61,505
Interest Rate
5.98%
Mortgage Type
Purchase Money Mortgage
Estimated Equity
$756,900
Purchase Details
Closed on
Apr 22, 2005
Sold by
Coastal Communties At Ocean Ridge Planta
Bought by
Christiansen Glenn H and Christiasen Alice L
Home Financials for this Owner
Home Financials are based on the most recent Mortgage that was taken out on this home.
Original Mortgage
$116,910
Outstanding Balance
$61,505
Interest Rate
5.98%
Mortgage Type
Purchase Money Mortgage
Estimated Equity
$756,900
Purchase Details
Closed on
Nov 1, 2001
Bought by
Christiansen Glenn H Et Alice L
Create a Home Valuation Report for This Property
The Home Valuation Report is an in-depth analysis detailing your home's value as well as a comparison with similar homes in the area
Home Values in the Area
Average Home Value in this Area
Purchase History
| Date | Buyer | Sale Price | Title Company |
|---|---|---|---|
| Christiansen Glenn H | $130,000 | None Available | |
| Christiansen Glenn H | $161,000 | None Available | |
| Christiansen Glenn H Et Alice L | $75,000 | -- |
Source: Public Records
Mortgage History
| Date | Status | Borrower | Loan Amount |
|---|---|---|---|
| Open | Christiansen Glenn H | $116,910 | |
| Closed | Christiansen Glenn H | $144,810 |
Source: Public Records
Tax History Compared to Growth
Tax History
| Year | Tax Paid | Tax Assessment Tax Assessment Total Assessment is a certain percentage of the fair market value that is determined by local assessors to be the total taxable value of land and additions on the property. | Land | Improvement |
|---|---|---|---|---|
| 2025 | $2,271 | $559,480 | $48,000 | $511,480 |
| 2024 | $2,271 | $548,070 | $48,000 | $500,070 |
| 2023 | $2,836 | $548,070 | $48,000 | $500,070 |
| 2022 | $2,836 | $502,880 | $52,000 | $450,880 |
| 2021 | $2,820 | $499,670 | $52,000 | $447,670 |
| 2020 | $2,795 | $499,670 | $52,000 | $447,670 |
| 2019 | $2,795 | $54,180 | $52,000 | $2,180 |
| 2018 | $2,320 | $52,690 | $50,000 | $2,690 |
| 2017 | $2,195 | $52,690 | $50,000 | $2,690 |
| 2016 | $2,145 | $52,690 | $50,000 | $2,690 |
| 2015 | $2,147 | $401,470 | $50,000 | $351,470 |
| 2014 | $1,945 | $394,342 | $100,000 | $294,342 |
Source: Public Records
Map
Nearby Homes
- 6615 Regent Ct SW
- 565 Gladstone Cir SW
- 6618 Dunrobin Point SW
- 545 Gladstone Cir SW
- 6654 Annesbrook Place
- 513 Cliffside Point SW
- 558 Westchester Place SW
- 1042 Beechridge Dr Unit 70
- 1038 Beechridge Dr SW Unit 71
- 513 Belfort Ln SW Unit 76
- 505 Belfort Ln SW Unit 74
- 1030 Beechridge Dr SW Unit 73
- 6618 Annesbrook Place
- 512 Belfort Ln SW Unit 148
- 503 Cromwell Notch SW
- 339 Glendale Arbor Dr SW Unit 138
- 131 Pine Lake Cir SW
- 6452 Kirkwall Point SW
- 521 Lindgrove Place SW
- 6457 Kirkwall Point SW
- L-39 Stratton Place
- 0 Stratton Place SW
- 528 Preserve Point SW
- 523 Stratton Place SW
- 6605 Castlebrook Way SW
- 528 Stratton Place SW
- 524 Preserve Point SW
- 6603 Becket Notch SW
- 6603 SW
- 524 Stratton Place SW
- 0 Regent Ct SW
- 522 Preserve Point SW
- 534 Longfellow Place SW
- 6605 Becket Notch SW
- 6604 Becket Notch L-73
- 568 Gladstone Cir SW
- 536 Longfellow Place SW
- 533 Longfellow Place SW
- 6611 Regent Ct
- 531 Longfellow Place SW