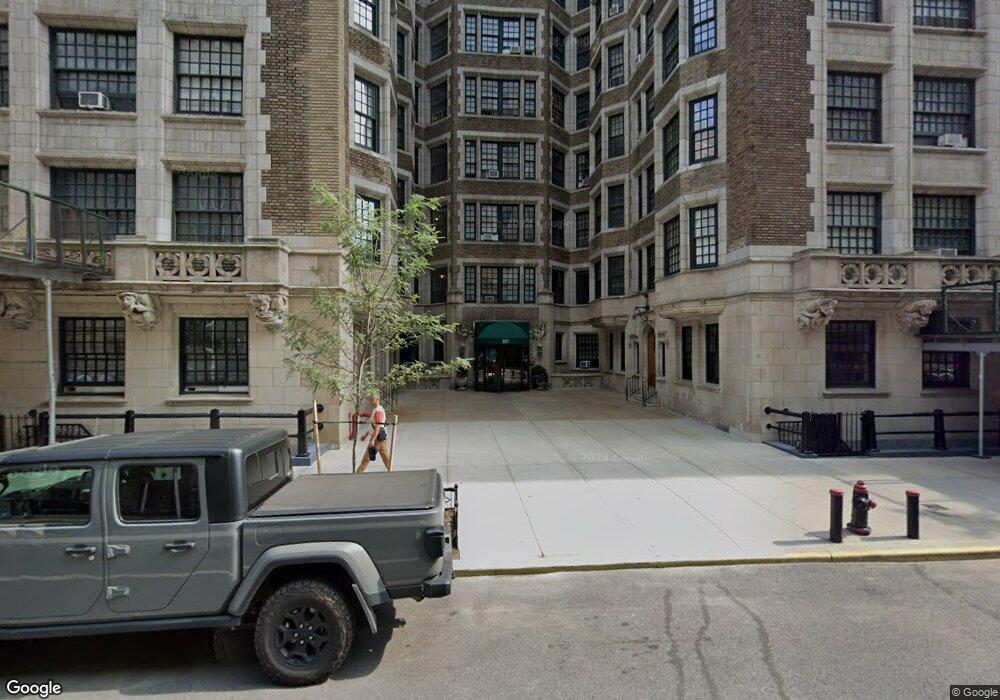
The Britannia 527 W 110th St Unit 5 New York, NY 10025
Morningside Heights NeighborhoodEstimated Value: $845,757 - $1,331,000
2
Beds
--
Bath
800
Sq Ft
$1,230/Sq Ft
Est. Value
About This Home
This home is located at 527 W 110th St Unit 5, New York, NY 10025 and is currently estimated at $983,689, approximately $1,229 per square foot. 527 W 110th St Unit 5 is a home located in New York County with nearby schools including P.S. 165 - Robert E. Simon, Bank Street School for Children, and St Hilda's & St Hugh's School.
Ownership History
Date
Name
Owned For
Owner Type
Purchase Details
Closed on
Mar 13, 2019
Sold by
Zainy Llc
Bought by
Broad Tanya Mohn and Broad William Joseph
Current Estimated Value
Home Financials for this Owner
Home Financials are based on the most recent Mortgage that was taken out on this home.
Original Mortgage
$0
Interest Rate
4.3%
Mortgage Type
Unknown
Purchase Details
Closed on
Oct 16, 2015
Sold by
Flynt James E and Livengood Jerome
Bought by
Zainy Llc
Purchase Details
Closed on
Jan 28, 2008
Sold by
Livengood Jerome
Bought by
Flynt James E and Livengood Jerome
Purchase Details
Closed on
Jul 11, 2006
Sold by
Flynt James E and Livengood Jerome
Bought by
Livengood Jerome
Create a Home Valuation Report for This Property
The Home Valuation Report is an in-depth analysis detailing your home's value as well as a comparison with similar homes in the area
Home Values in the Area
Average Home Value in this Area
Purchase History
| Date | Buyer | Sale Price | Title Company |
|---|---|---|---|
| Broad Tanya Mohn | $975,000 | -- | |
| Broad Tanya Mohn | $975,000 | -- | |
| Zainy Llc | $815,000 | -- | |
| Zainy Llc | $815,000 | -- | |
| Flynt James E | -- | -- | |
| Flynt James E | -- | -- | |
| Livengood Jerome | -- | -- | |
| Livengood Jerome | -- | -- |
Source: Public Records
Mortgage History
| Date | Status | Borrower | Loan Amount |
|---|---|---|---|
| Closed | Broad Tanya Mohn | $0 | |
| Open | Broad Tanya Mohn | $200,000 | |
| Closed | Broad Tanya Mohn | $200,000 |
Source: Public Records
Tax History Compared to Growth
Tax History
| Year | Tax Paid | Tax Assessment Tax Assessment Total Assessment is a certain percentage of the fair market value that is determined by local assessors to be the total taxable value of land and additions on the property. | Land | Improvement |
|---|---|---|---|---|
| 2025 | $10,076 | $80,490 | $7,370 | $73,120 |
| 2024 | $10,076 | $80,595 | $7,370 | $73,225 |
| 2023 | $10,238 | $83,463 | $7,370 | $76,093 |
| 2022 | $7,965 | $91,630 | $7,370 | $84,260 |
| 2021 | $8,812 | $71,834 | $7,370 | $64,464 |
| 2020 | $9,076 | $80,630 | $7,370 | $73,260 |
| 2019 | $7,027 | $81,365 | $7,370 | $73,995 |
| 2018 | $7,905 | $70,022 | $7,370 | $62,652 |
| 2017 | $7,590 | $73,034 | $7,370 | $65,664 |
| 2016 | $7,124 | $63,799 | $7,370 | $56,429 |
| 2015 | $1,378 | $60,871 | $7,370 | $53,501 |
| 2014 | $1,378 | $57,314 | $7,370 | $49,944 |
Source: Public Records
About The Britannia
Map
Nearby Homes
- 536 W 111th St Unit 67
- 535 W 110th St Unit 4A
- 545 W 111th St Unit 10I
- 545 W 110th St Unit 2B
- 545 W 110th St Unit 9D
- 545 W 110th St Unit PH 11 A
- 504 W 111th St Unit 11
- 600 W 111th St Unit 10D
- 600 W 111th St Unit 9G
- 600 W 111th St Unit 4D
- 510 W 110th St Unit 10B
- 605 W 111th St Unit 43
- 1046 Amsterdam Ave Unit 24
- 610 W 110th St Unit 6C
- 610 W 110th St Unit 8-AB
- 611 W 111th St Unit 6
- 611 W 111th St Unit 27
- 611 W 111th St Unit 25
- 611 W 111th St Unit G2
- 380 Riverside Dr Unit 2-CD
- 527 W 110th St
- 527 W 110th St Unit 42
- 527 W 110th St Unit 10
- 527 W 110th St Unit 9
- 527 W 110th St Unit 8
- 527 W 110th St Unit 96
- 527 W 110th St Unit 86
- 527 W 110th St Unit 76
- 527 W 110th St Unit 66
- 527 W 110th St Unit 56
- 527 W 110th St Unit 46
- 527 W 110th St Unit 36
- 527 W 110th St Unit 26
- 527 W 110th St Unit 6
- 527 W 110th St Unit 85
- 527 W 110th St Unit 75
- 527 W 110th St Unit 65
- 527 W 110th St Unit 55
- 527 W 110th St Unit 45
- 527 W 110th St Unit 35