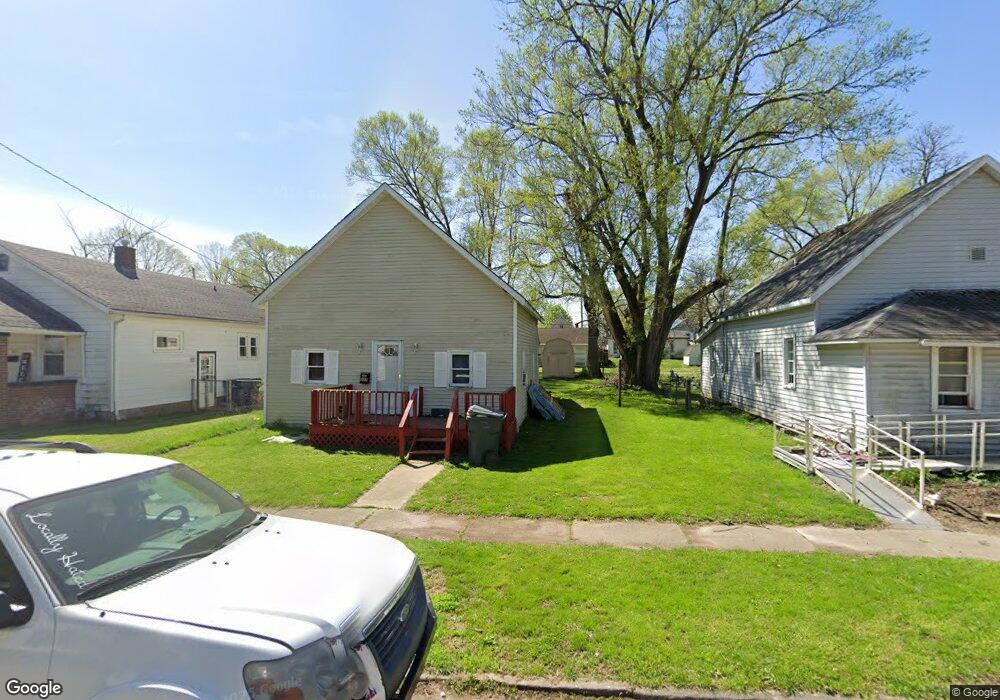
527 W 2nd St Anderson, IN 46016
Estimated Value: $62,000 - $103,000
2
Beds
1
Bath
864
Sq Ft
$93/Sq Ft
Est. Value
About This Home
This home is located at 527 W 2nd St, Anderson, IN 46016 and is currently estimated at $79,973, approximately $92 per square foot. 527 W 2nd St is a home located in Madison County with nearby schools including Eastside Elementary School, Highland Middle School, and Anderson High School.
Ownership History
Date
Name
Owned For
Owner Type
Purchase Details
Closed on
Nov 8, 2023
Sold by
Caplinger Carol A
Bought by
Caplinger Family Trust and Caplinger
Current Estimated Value
Purchase Details
Closed on
Sep 10, 2015
Sold by
Caplinger Larry L and Caplinger Carol A
Bought by
Caplinger Properties Llc
Purchase Details
Closed on
Apr 8, 2010
Sold by
Sandefur Kenneth D and Sandefur Deena
Bought by
Caplinger Carol A and Caplinger Larry L
Purchase Details
Closed on
Sep 15, 2009
Sold by
Federal National Mortgage Association
Bought by
Sandefur Kenneth D and Sandefur Deena K
Purchase Details
Closed on
May 8, 2009
Sold by
Brown Larry J and Brown Larry
Bought by
Federal National Mortgage Association
Create a Home Valuation Report for This Property
The Home Valuation Report is an in-depth analysis detailing your home's value as well as a comparison with similar homes in the area
Home Values in the Area
Average Home Value in this Area
Purchase History
| Date | Buyer | Sale Price | Title Company |
|---|---|---|---|
| Caplinger Family Trust | -- | None Listed On Document | |
| Caplinger Properties Llc | -- | -- | |
| Caplinger Carol A | -- | -- | |
| Sandefur Kenneth D | -- | -- | |
| Federal National Mortgage Association | $39,050 | -- |
Source: Public Records
Tax History Compared to Growth
Tax History
| Year | Tax Paid | Tax Assessment Tax Assessment Total Assessment is a certain percentage of the fair market value that is determined by local assessors to be the total taxable value of land and additions on the property. | Land | Improvement |
|---|---|---|---|---|
| 2024 | $544 | $24,500 | $8,100 | $16,400 |
| 2023 | $510 | $22,600 | $7,700 | $14,900 |
| 2022 | $503 | $22,300 | $7,200 | $15,100 |
| 2021 | $473 | $20,900 | $7,200 | $13,700 |
| 2020 | $453 | $19,900 | $6,800 | $13,100 |
| 2019 | $444 | $19,500 | $6,800 | $12,700 |
| 2018 | $428 | $18,400 | $6,800 | $11,600 |
| 2017 | $369 | $18,300 | $6,800 | $11,500 |
| 2016 | $369 | $18,300 | $6,800 | $11,500 |
| 2014 | $367 | $18,200 | $6,900 | $11,300 |
| 2013 | $367 | $18,200 | $6,900 | $11,300 |
Source: Public Records
Map
Nearby Homes