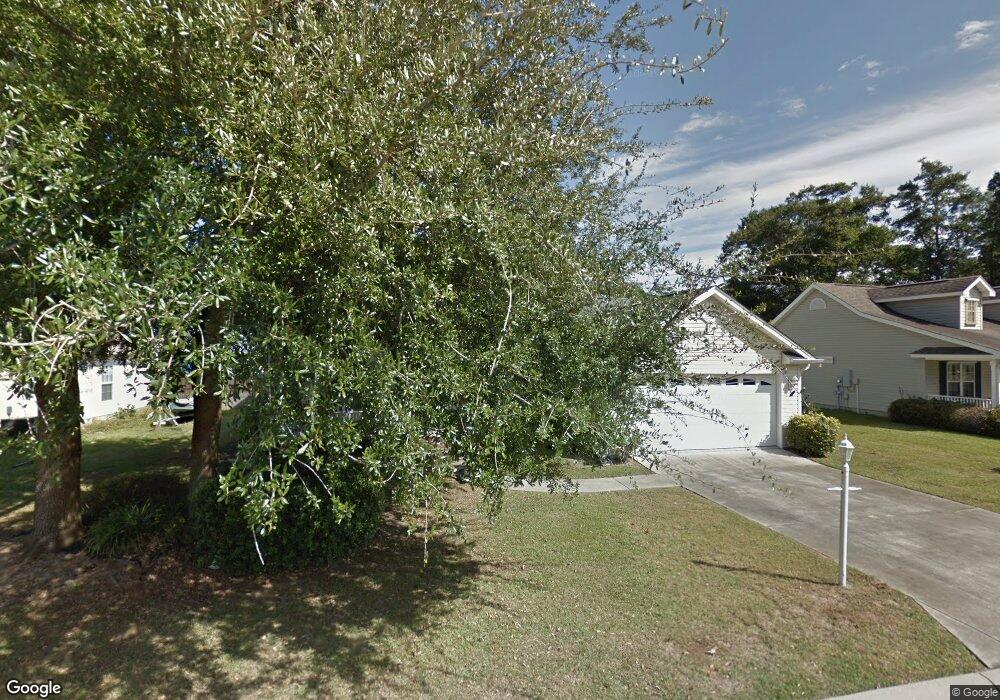
527 Waverly Loop Murrells Inlet, SC 29576
Estimated Value: $335,000 - $418,000
3
Beds
2
Baths
1,565
Sq Ft
$237/Sq Ft
Est. Value
About This Home
This home is located at 527 Waverly Loop, Murrells Inlet, SC 29576 and is currently estimated at $371,043, approximately $237 per square foot. 527 Waverly Loop is a home located in Horry County with nearby schools including Seaside Elementary, St. James Intermediate, and St. James High School.
Ownership History
Date
Name
Owned For
Owner Type
Purchase Details
Closed on
Jan 26, 2007
Sold by
Good Samaritan Ministries Of Nc Inc
Bought by
Mcilwain Joelyn and Mcilwain Charles R
Current Estimated Value
Home Financials for this Owner
Home Financials are based on the most recent Mortgage that was taken out on this home.
Original Mortgage
$130,000
Outstanding Balance
$75,792
Interest Rate
6.14%
Mortgage Type
Purchase Money Mortgage
Estimated Equity
$295,251
Purchase Details
Closed on
Jun 26, 2000
Sold by
Chapman Billy H and Chapman Judy M
Bought by
Good Samaritan Ministries Of Nc Inc
Home Financials for this Owner
Home Financials are based on the most recent Mortgage that was taken out on this home.
Original Mortgage
$117,200
Interest Rate
8.63%
Mortgage Type
Purchase Money Mortgage
Purchase Details
Closed on
Nov 17, 1999
Sold by
Wave Development Llc
Bought by
Chapman Billy H and Chapman Judy M
Create a Home Valuation Report for This Property
The Home Valuation Report is an in-depth analysis detailing your home's value as well as a comparison with similar homes in the area
Home Values in the Area
Average Home Value in this Area
Purchase History
| Date | Buyer | Sale Price | Title Company |
|---|---|---|---|
| Mcilwain Joelyn | $227,905 | None Available | |
| Good Samaritan Ministries Of Nc Inc | $144,000 | -- | |
| Chapman Billy H | $30,900 | -- |
Source: Public Records
Mortgage History
| Date | Status | Borrower | Loan Amount |
|---|---|---|---|
| Open | Mcilwain Joelyn | $130,000 | |
| Previous Owner | Good Samaritan Ministries Of Nc Inc | $117,200 |
Source: Public Records
Tax History
| Year | Tax Paid | Tax Assessment Tax Assessment Total Assessment is a certain percentage of the fair market value that is determined by local assessors to be the total taxable value of land and additions on the property. | Land | Improvement |
|---|---|---|---|---|
| 2025 | $2,994 | $0 | $0 | $0 |
| 2024 | $2,994 | $19,534 | $7,461 | $12,073 |
| 2023 | $2,994 | $12,179 | $3,586 | $8,593 |
| 2021 | $2,574 | $13,277 | $4,145 | $9,132 |
| 2020 | $2,462 | $13,277 | $4,145 | $9,132 |
| 2019 | $2,462 | $13,277 | $4,145 | $9,132 |
| 2018 | $2,221 | $10,591 | $3,109 | $7,482 |
| 2017 | $2,206 | $10,591 | $3,109 | $7,482 |
| 2016 | -- | $10,591 | $3,109 | $7,482 |
| 2015 | $2,206 | $10,591 | $3,109 | $7,482 |
| 2014 | $2,087 | $10,591 | $3,109 | $7,482 |
Source: Public Records
Map
Nearby Homes
- 837 Flicker Place
- 852 Riven Oak Dr
- 434 Stanley Dr
- 596 Trizzie Trail
- 571 Fernwood Rd
- 879 Kittiwake Ln
- 598 Rum Gully Rd
- 425 E Surfwind Dr
- 40 Shamrock Cir
- 709 Mount Gilead Rd
- 510 Rum Gully Rd
- 34 Shamrock Cir
- 45 Shamrock Cir
- 2 Keel Ln
- 801 Rebecca Ln Unit 7A
- 527 Mount Gilead Rd
- 3011 Dillon Rd
- 181 Offshore Dr
- 17 Offshore Dr
- 14 Shamrock Cir
- LOT 10 Waverly Bay Unit WAVERLY BAY HOMESITE
- Lot 82 Waverly Bay
- Lot 62 Waverly Bay
- Lot 69 Waverly Bay
- Lot 80 Waverly Bay
- 20 Waverly Bay
- Lot 78 Waverly Bay Unit Grey Moss Road
- Lot 62 Waverly Bay Unit Grey Moss Road
- Lot 61 Waverly Bay
- Lot 21 Waverly Bay
- 525 Waverly Loop
- 529 Waverly Loop
- 553 Waverly Loop
- 551 Waverly Loop
- 511 Waverly Loop
- 526 Waverly Loop
- 528 Waverly Loop
- Lot 58 Waverly Loop
- LOT 75 Waverly Loop
- 531 Waverly Loop Unit Stanley Cove
Your Personal Tour Guide
Ask me questions while you tour the home.