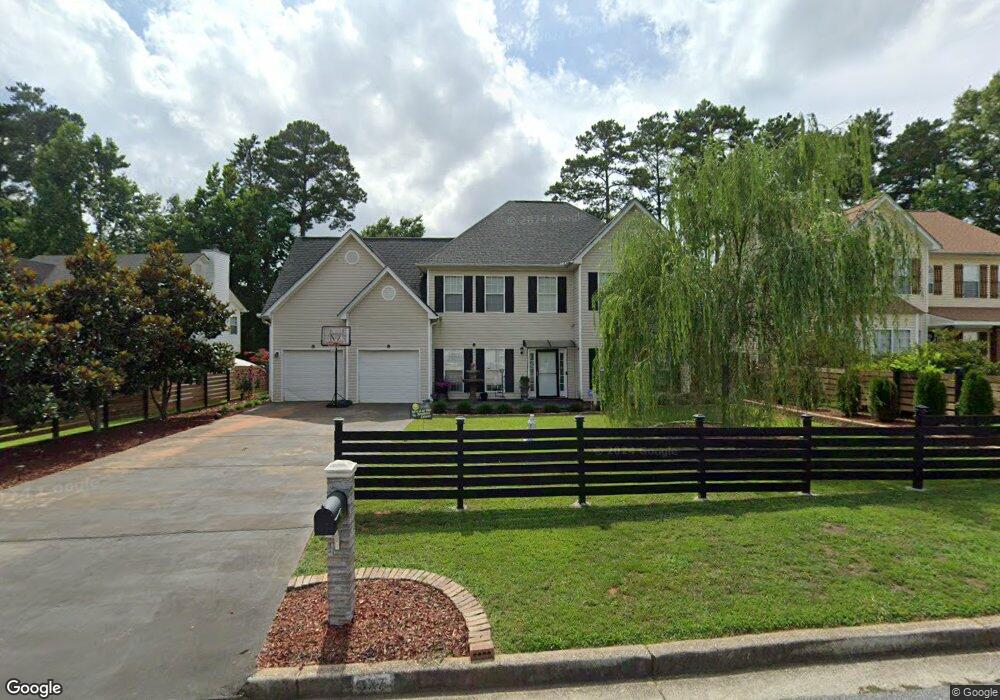
527 White Cedar Ct Riverdale, GA 30274
Estimated Value: $270,000 - $368,000
3
Beds
3
Baths
2,086
Sq Ft
$145/Sq Ft
Est. Value
About This Home
This home is located at 527 White Cedar Ct, Riverdale, GA 30274 and is currently estimated at $302,171, approximately $144 per square foot. 527 White Cedar Ct is a home located in Clayton County with nearby schools including Pointe South Elementary School, Pointe South Middle School, and Riverdale High School.
Ownership History
Date
Name
Owned For
Owner Type
Purchase Details
Closed on
Sep 11, 2019
Sold by
Zebcon Llc
Bought by
Oliver Elizabeth and Oliver Sarah
Current Estimated Value
Purchase Details
Closed on
Jul 28, 2006
Sold by
Henderson Spurgeon and Henderson Jacqueline
Bought by
Oliver Elizabeth C and Oliver Sarah L
Home Financials for this Owner
Home Financials are based on the most recent Mortgage that was taken out on this home.
Original Mortgage
$123,520
Interest Rate
6.68%
Mortgage Type
New Conventional
Purchase Details
Closed on
Sep 15, 2002
Sold by
Henderson Marlowe I
Bought by
Henderson Spurgeon and Henderson Jacqueline
Purchase Details
Closed on
Sep 29, 2000
Sold by
Pineland Homes Inc
Bought by
Henderson Marlowe I
Home Financials for this Owner
Home Financials are based on the most recent Mortgage that was taken out on this home.
Original Mortgage
$150,900
Interest Rate
7.94%
Mortgage Type
FHA
Create a Home Valuation Report for This Property
The Home Valuation Report is an in-depth analysis detailing your home's value as well as a comparison with similar homes in the area
Home Values in the Area
Average Home Value in this Area
Purchase History
| Date | Buyer | Sale Price | Title Company |
|---|---|---|---|
| Oliver Elizabeth | $40,000 | -- | |
| Oliver Elizabeth C | $154,400 | -- | |
| Henderson Spurgeon | -- | -- | |
| Henderson Marlowe I | $151,100 | -- |
Source: Public Records
Mortgage History
| Date | Status | Borrower | Loan Amount |
|---|---|---|---|
| Previous Owner | Oliver Elizabeth C | $123,520 | |
| Previous Owner | Henderson Marlowe I | $150,900 |
Source: Public Records
Tax History Compared to Growth
Tax History
| Year | Tax Paid | Tax Assessment Tax Assessment Total Assessment is a certain percentage of the fair market value that is determined by local assessors to be the total taxable value of land and additions on the property. | Land | Improvement |
|---|---|---|---|---|
| 2024 | $4,445 | $122,960 | $8,000 | $114,960 |
| 2023 | $4,054 | $112,280 | $8,000 | $104,280 |
| 2022 | $3,476 | $87,600 | $8,000 | $79,600 |
| 2021 | $2,792 | $69,720 | $8,000 | $61,720 |
| 2020 | $2,371 | $58,326 | $8,000 | $50,326 |
| 2019 | $2,150 | $52,033 | $6,000 | $46,033 |
| 2018 | $2,148 | $51,965 | $6,000 | $45,965 |
| 2017 | $1,612 | $38,682 | $6,000 | $32,682 |
| 2016 | $1,454 | $34,804 | $6,000 | $28,804 |
| 2015 | $1,040 | $0 | $0 | $0 |
| 2014 | $921 | $22,194 | $6,000 | $16,194 |
Source: Public Records
Map
Nearby Homes
- 8601 Cedar Creek Ridge
- 8614 Webb Rd
- 8624 Webb Rd
- 8626 Webb Rd
- 8632 Webb Rd
- 8638 Webb Rd
- 8640 Webb Rd
- 8644 Webb Rd
- 8646 Webb Rd
- 8650 Webb Rd
- 8652 Webb Rd
- 8654 Webb Rd
- 8455 Cedar Creek Ridge
- 8495 Glendevon Ct
- 8661 Guthrie Dr
- 553 Wellington Way
- 578 Wellington Way
- 8579 Glenwoods Dr
- 638 Wellington Way
- 530 Wexwood Dr Unit 1
- 519 White Cedar Ct Unit 5C
- 535 White Cedar Ct
- 511 White Cedar Ct
- 539 White Cedar Ct
- 524 White Cedar Ct Unit 5D
- 532 White Cedar Ct
- 8622 Thomas Rd
- 516 White Cedar Ct Unit 5C
- 8620 Thomas Rd
- 8620 Thomas Rd Unit 8620
- 8618 Thomas Rd
- 8616 Thomas Rd
- 8628 Thomas Dr
- 8630 Thomas Rd
- 503 White Cedar Ct
- 8614 Thomas Rd
- 8632 Thomas Rd
- 8612 Thomas Rd
- 8634 Thomas Rd
- 543 White Cedar Ct