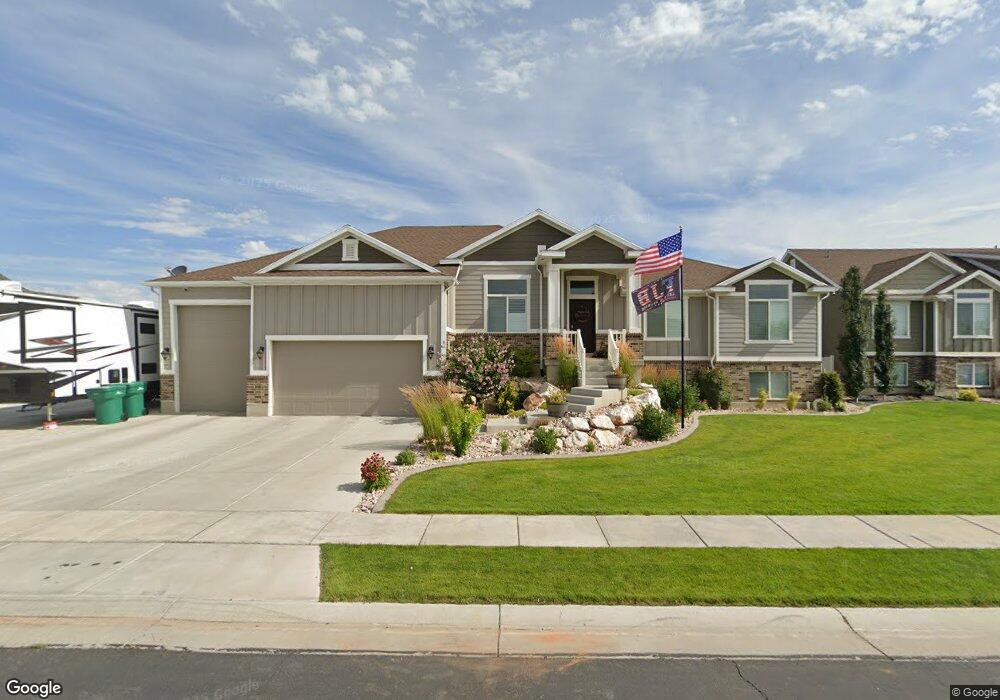
5270 W 3550 S Unit 16 Hooper, UT 84315
Estimated Value: $762,000 - $863,000
3
Beds
2
Baths
3,910
Sq Ft
$205/Sq Ft
Est. Value
About This Home
This home is located at 5270 W 3550 S Unit 16, Hooper, UT 84315 and is currently estimated at $802,584, approximately $205 per square foot. 5270 W 3550 S Unit 16 is a home located in Weber County with nearby schools including Hooper Elementary School, Rocky Mountain Junior High School, and Fremont High School.
Ownership History
Date
Name
Owned For
Owner Type
Purchase Details
Closed on
Dec 8, 2017
Sold by
Nilson & Co Inc
Bought by
Shanefelt Ryan and Shanefelt Emily
Current Estimated Value
Home Financials for this Owner
Home Financials are based on the most recent Mortgage that was taken out on this home.
Original Mortgage
$4,241,000
Outstanding Balance
$3,570,551
Interest Rate
3.94%
Mortgage Type
New Conventional
Estimated Equity
-$2,767,967
Purchase Details
Closed on
Apr 12, 2017
Sold by
Quail Meadows Properties Llc
Bought by
It To Nilson And Company Inc and Nilson Homes
Home Financials for this Owner
Home Financials are based on the most recent Mortgage that was taken out on this home.
Original Mortgage
$316,000
Interest Rate
4.3%
Mortgage Type
New Conventional
Create a Home Valuation Report for This Property
The Home Valuation Report is an in-depth analysis detailing your home's value as well as a comparison with similar homes in the area
Home Values in the Area
Average Home Value in this Area
Purchase History
| Date | Buyer | Sale Price | Title Company |
|---|---|---|---|
| Shanefelt Ryan | -- | Stewart Title Ins Agency | |
| It To Nilson And Company Inc | -- | Stella Title Ins Agency |
Source: Public Records
Mortgage History
| Date | Status | Borrower | Loan Amount |
|---|---|---|---|
| Open | Shanefelt Ryan | $4,241,000 | |
| Previous Owner | It To Nilson And Company Inc | $316,000 |
Source: Public Records
Tax History Compared to Growth
Tax History
| Year | Tax Paid | Tax Assessment Tax Assessment Total Assessment is a certain percentage of the fair market value that is determined by local assessors to be the total taxable value of land and additions on the property. | Land | Improvement |
|---|---|---|---|---|
| 2025 | $4,263 | $757,542 | $224,996 | $532,546 |
| 2024 | $4,099 | $408,099 | $123,730 | $284,369 |
| 2023 | $4,352 | $429,551 | $123,734 | $305,817 |
| 2022 | $4,326 | $436,700 | $104,490 | $332,210 |
| 2021 | $3,456 | $590,000 | $124,944 | $465,056 |
| 2020 | $3,252 | $509,000 | $114,942 | $394,058 |
| 2019 | $3,122 | $462,000 | $99,804 | $362,196 |
| 2018 | $2,740 | $388,000 | $79,924 | $308,076 |
| 2017 | $1,066 | $64,961 | $64,961 | $0 |
| 2016 | -- | $0 | $0 | $0 |
Source: Public Records
Map
Nearby Homes
- 5478 W 3750 S
- 5389 W 3850 S Unit 22
- 5417 W 3850 S
- 4941 W 3575 S
- 3731 S 4975 W
- 3691 S 5600 W Unit 20
- 3223 S 4975 W Unit 15
- 3257 S 4975 W Unit 12
- 3269 S 4975 W Unit 11
- 3233 S 4975 W Unit 14
- 3243 S 4950 W Unit 25
- 3263 S 4950 W Unit 24
- 3225 S 4950 W Unit 26
- 3198 S 4950 W Unit 29
- 3192 S 4950 W Unit 28
- 3238 S 4950 W
- 3706 S 5650 W Unit 9
- 4111 S 5350 W
- 3660 S 4700 W
- 3215 S 4950 W Unit 27
- 5286 W 3550 S Unit LOT 17
- 5258 W 3550 S Unit LOT 15
- 5314 W 3550 S Unit 18
- 3557 S 5250 W Unit 26
- 3557 S 5250 W
- 5242 W 3550 S Unit 14
- 3556 S 5325 W Unit 25
- 3563 S 5250 W
- 5334 W 3550 S
- 3568 S 5325 W
- 3553 S 5325 W Unit 21
- 5232 W 3575 S
- 3737 S 5325 W Unit 42
- 3701 S 5325 W Unit 40
- 3738 S 5325 W Unit 28
- 3673 S 5325 W Unit 38
- 3698 S 5325 W Unit 30
- 3573 S 5250 W
- 5342 W 3550 S Unit 20
- 5204 W 3575 S