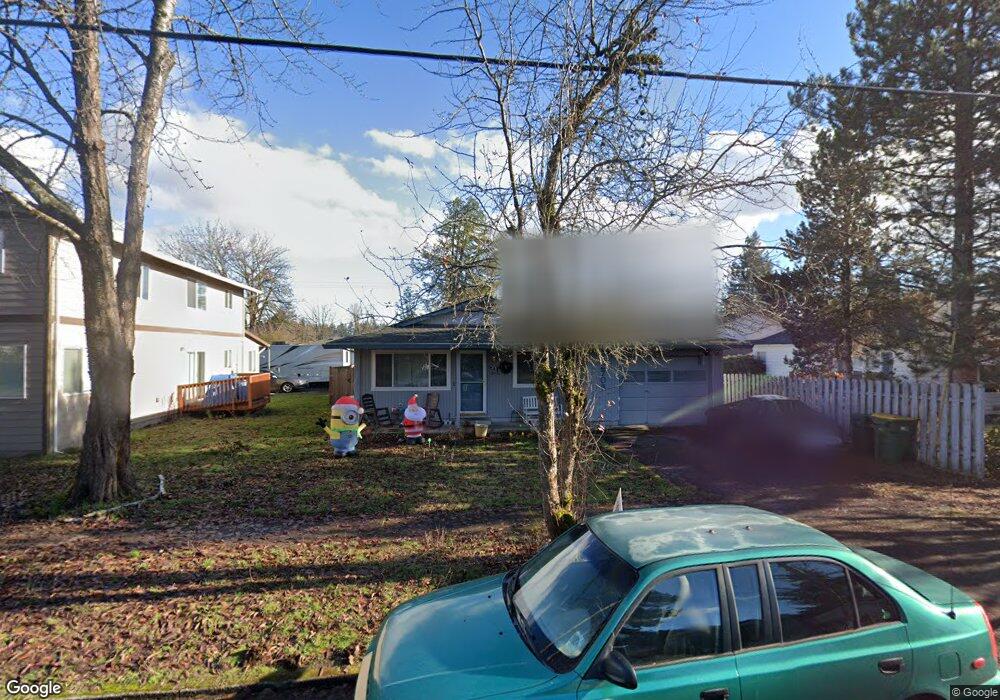
52706 NE 2nd St Scappoose, OR 97056
Estimated Value: $345,000 - $387,000
3
Beds
1
Bath
1,090
Sq Ft
$335/Sq Ft
Est. Value
About This Home
This home is located at 52706 NE 2nd St, Scappoose, OR 97056 and is currently estimated at $364,999, approximately $334 per square foot. 52706 NE 2nd St is a home located in Columbia County with nearby schools including Scappoose High School, South Columbia Family School, and Scappoose Adventist School.
Ownership History
Date
Name
Owned For
Owner Type
Purchase Details
Closed on
Aug 26, 2021
Sold by
Drak Jonny
Bought by
Johnson Amanda
Current Estimated Value
Home Financials for this Owner
Home Financials are based on the most recent Mortgage that was taken out on this home.
Original Mortgage
$236,250
Outstanding Balance
$213,697
Interest Rate
2.7%
Mortgage Type
New Conventional
Estimated Equity
$151,302
Purchase Details
Closed on
Dec 7, 2015
Sold by
Redman Michael D and Redman Carol R
Bought by
Drak Jonny
Home Financials for this Owner
Home Financials are based on the most recent Mortgage that was taken out on this home.
Original Mortgage
$123,500
Interest Rate
3.83%
Mortgage Type
New Conventional
Purchase Details
Closed on
Jun 16, 2005
Sold by
Bradford Arlington
Bought by
Redman Michael D and Redman Carol R
Home Financials for this Owner
Home Financials are based on the most recent Mortgage that was taken out on this home.
Original Mortgage
$119,900
Interest Rate
5.72%
Mortgage Type
Fannie Mae Freddie Mac
Create a Home Valuation Report for This Property
The Home Valuation Report is an in-depth analysis detailing your home's value as well as a comparison with similar homes in the area
Home Values in the Area
Average Home Value in this Area
Purchase History
| Date | Buyer | Sale Price | Title Company |
|---|---|---|---|
| Johnson Amanda | $315,000 | Ticor Title | |
| Drak Jonny | $183,500 | Ticor Title | |
| Redman Michael D | $149,900 | Columbia County Title |
Source: Public Records
Mortgage History
| Date | Status | Borrower | Loan Amount |
|---|---|---|---|
| Open | Johnson Amanda | $236,250 | |
| Previous Owner | Drak Jonny | $123,500 | |
| Previous Owner | Redman Michael D | $119,900 |
Source: Public Records
Tax History Compared to Growth
Tax History
| Year | Tax Paid | Tax Assessment Tax Assessment Total Assessment is a certain percentage of the fair market value that is determined by local assessors to be the total taxable value of land and additions on the property. | Land | Improvement |
|---|---|---|---|---|
| 2025 | $2,954 | $179,430 | $92,170 | $87,260 |
| 2024 | $2,872 | $174,210 | $89,490 | $84,720 |
| 2023 | $2,846 | $169,140 | $85,950 | $83,190 |
| 2022 | $2,726 | $164,220 | $83,440 | $80,780 |
| 2021 | $2,648 | $159,440 | $88,380 | $71,060 |
| 2020 | $2,456 | $154,800 | $85,460 | $69,340 |
| 2019 | $2,392 | $150,300 | $82,410 | $67,890 |
| 2018 | $2,337 | $145,930 | $93,900 | $52,030 |
| 2017 | $2,295 | $141,680 | $91,170 | $50,510 |
| 2016 | $2,266 | $137,560 | $88,520 | $49,040 |
| 2015 | $2,092 | $133,200 | $85,610 | $47,590 |
| 2014 | $2,107 | $133,560 | $76,140 | $57,420 |
Source: Public Records
Map
Nearby Homes
- 52866 NE 2nd St
- 33399 NW Ej Smith Rd
- 33374 Wickstrom Dr
- 51587 SE Oak St
- 51425 SE Oak St Unit 65
- 53194 Columbia River Hwy
- 52256 SE 6th Ct
- 52171 Casswell Dr
- 32904 NW View Terrace Place
- 32952 NW Ridge Dr
- 52269 SE Tyler St
- 52144 SE 8th St
- 33375 SW Rokin Way
- 33363 SW Rokin Way
- 33062 Bellcrest Rd
- 33374 SW Rokin Way
- 33358 SW Rokin Way
- 33344 SW Rokin Way
- 52238 Teakwood Dr
- 51925 Columbia River Hwy
- 52688 NE 2nd St
- 33594 NE Williams St
- 52699 NE 3rd St
- 33615 NE Laurel St
- 52697 NE 2nd St
- 52709 NE 2nd St
- 52687 NE 2nd St
- 33609 NE Williams St
- 33593 NE Williams St
- 52666 NE 2nd St
- 33620 NE Laurel St
- 52735 NE 2nd St
- 52710 NE 3rd St
- 52667 NE 2nd St
- 52698 NE 3rd St
- 33544 NE Williams St
- 52749 NE 3rd St
- 52657 NE 3rd St
- 52670 NE 3rd St
- 33545 NE Williams St