Estimated Value: $263,000 - $277,531
3
Beds
2
Baths
1,046
Sq Ft
$260/Sq Ft
Est. Value
About This Home
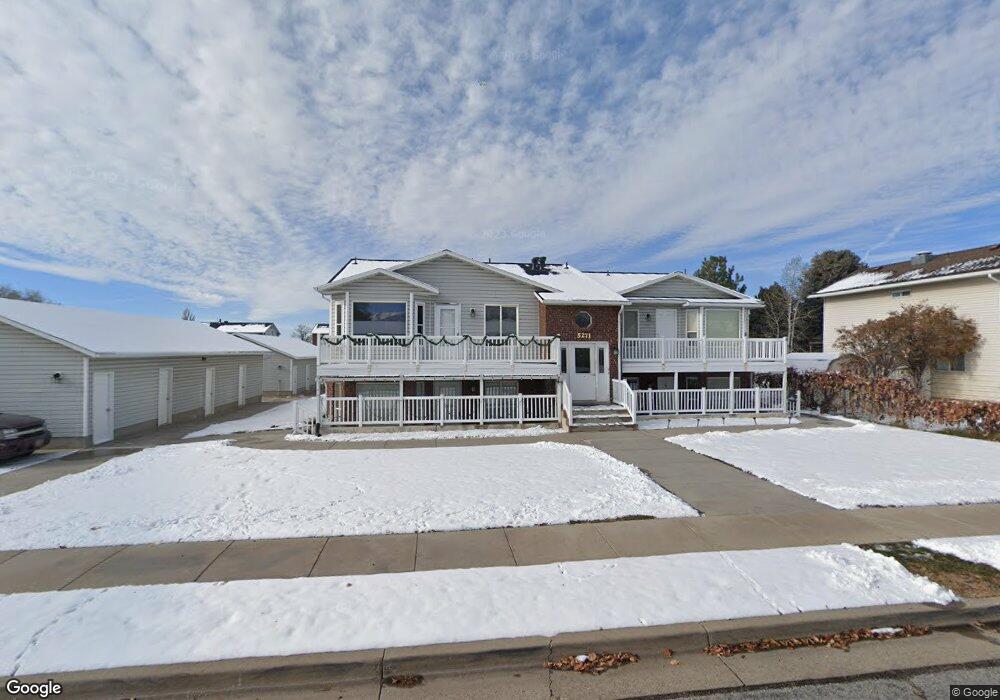
This home is located at 5271 S 2775 W Unit 5A, Roy, UT 84067 and is currently estimated at $271,633, approximately $259 per square foot. 5271 S 2775 W Unit 5A is a home located in Weber County with nearby schools including Roy Elementary School, Roy Junior High School, and Roy High School.
Ownership History
Date
Name
Owned For
Owner Type
Purchase Details
Closed on
Jun 6, 2024
Sold by
Gomm Deborah
Bought by
Deborah Gomm Living Trust and Gomm
Current Estimated Value
Purchase Details
Closed on
Oct 6, 2017
Sold by
Kearl Dustin
Bought by
Gomm Deborah
Purchase Details
Closed on
Jul 3, 2013
Sold by
Kearl Dustin and Winterton Laura L
Bought by
Kearl Dustin
Home Financials for this Owner
Home Financials are based on the most recent Mortgage that was taken out on this home.
Original Mortgage
$100,024
Interest Rate
4.4%
Mortgage Type
FHA
Purchase Details
Closed on
Jul 15, 2008
Sold by
Sharp Don
Bought by
Kearl Dustin and Winterton Laura L
Purchase Details
Closed on
Apr 24, 1998
Sold by
Shron Inc
Bought by
Sharp Don
Create a Home Valuation Report for This Property
The Home Valuation Report is an in-depth analysis detailing your home's value as well as a comparison with similar homes in the area
Home Values in the Area
Average Home Value in this Area
Purchase History
| Date | Buyer | Sale Price | Title Company |
|---|---|---|---|
| Deborah Gomm Living Trust | -- | None Listed On Document | |
| Gomm Deborah | -- | Security Title Of Davis Coun | |
| Kearl Dustin | -- | North American Title Union P | |
| Kearl Dustin | -- | Us Title Utah | |
| Sharp Don | -- | Us Title Utah |
Source: Public Records
Mortgage History
| Date | Status | Borrower | Loan Amount |
|---|---|---|---|
| Previous Owner | Kearl Dustin | $100,024 |
Source: Public Records
Tax History Compared to Growth
Tax History
| Year | Tax Paid | Tax Assessment Tax Assessment Total Assessment is a certain percentage of the fair market value that is determined by local assessors to be the total taxable value of land and additions on the property. | Land | Improvement |
|---|---|---|---|---|
| 2025 | $1,513 | $266,825 | $65,000 | $201,825 |
| 2024 | $1,463 | $143,000 | $35,750 | $107,250 |
| 2023 | $1,495 | $146,300 | $35,750 | $110,550 |
| 2022 | $1,440 | $143,550 | $35,750 | $107,800 |
| 2021 | $1,167 | $193,000 | $25,000 | $168,000 |
| 2020 | $1,110 | $168,000 | $25,000 | $143,000 |
| 2019 | $1,077 | $154,000 | $25,000 | $129,000 |
| 2018 | $925 | $125,000 | $20,000 | $105,000 |
| 2017 | $785 | $100,000 | $15,000 | $85,000 |
| 2016 | $633 | $43,450 | $8,250 | $35,200 |
| 2015 | $559 | $39,600 | $11,000 | $28,600 |
| 2014 | $566 | $39,600 | $11,000 | $28,600 |
Source: Public Records
Map
Nearby Homes
- 5271 S 2775 W Unit DR
- 5271 S 2775 W Unit 5C
- 5271 S 2775 W Unit 5B
- 5271 S 2775 W
- 5271 S 2775 W Unit D
- 5271 S 2775 W Unit B
- 5271 S 2775 W Unit 5D
- 5271 S 2775 W Unit C
- 5229 S 2775 W
- 2784 W 5275 S Unit 4D
- 2784 W 5275 S Unit 4C
- 2784 W 5275 S Unit 4B
- 2784 W 5275 S Unit 4A
- 2784 W 5275 S Unit C
- 2784 W 5275 S
- 5720 S 2800 W Unit 3C
- 5279 2775 St W Unit 3C
- 2778 W 5300 S
- 5223 S 2775 W
- 5270 S 2800 W Unit 3D