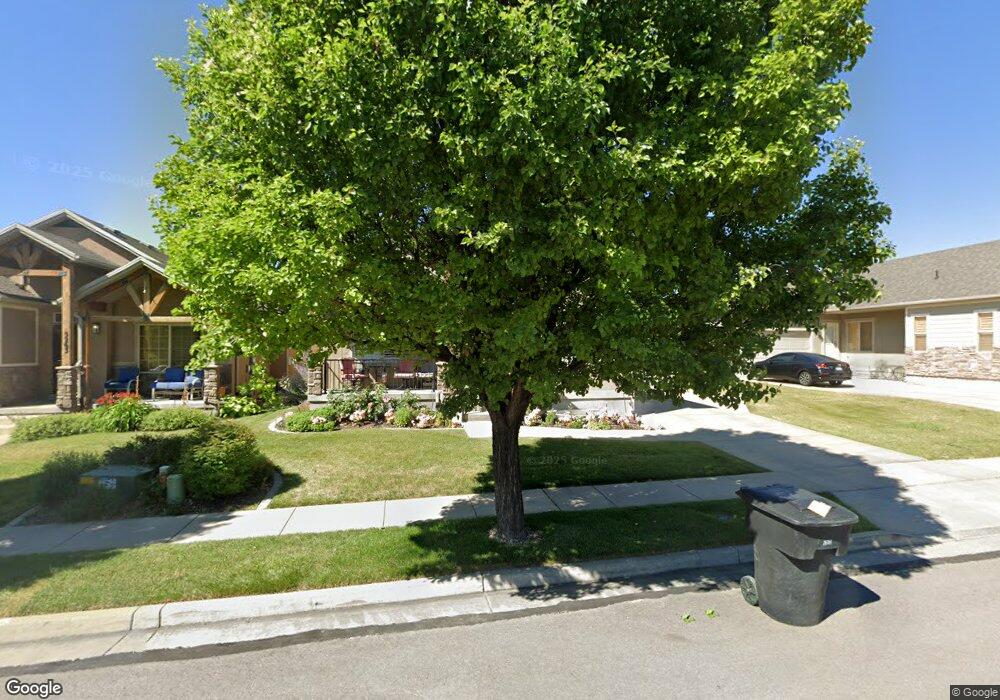
5271 Swift Water Way West Jordan, UT 84081
Cobble Creek NeighborhoodEstimated Value: $558,000 - $594,000
3
Beds
2
Baths
1,462
Sq Ft
$394/Sq Ft
Est. Value
About This Home
This home is located at 5271 Swift Water Way, West Jordan, UT 84081 and is currently estimated at $576,322, approximately $394 per square foot. 5271 Swift Water Way is a home located in Salt Lake County with nearby schools including Hayden Peak Elementary School, West Hills Middle School, and Copper Hills High School.
Ownership History
Date
Name
Owned For
Owner Type
Purchase Details
Closed on
Feb 5, 2018
Sold by
Daw Owen B and Daw Gwen C
Bought by
Daw Owen B and Daw Gwen C
Current Estimated Value
Purchase Details
Closed on
Nov 30, 2017
Sold by
Gonzales Fred E and Gonzales Kathryn G
Bought by
Daw Owen B and Daw Gwen C
Home Financials for this Owner
Home Financials are based on the most recent Mortgage that was taken out on this home.
Original Mortgage
$288,325
Outstanding Balance
$242,367
Interest Rate
3.88%
Mortgage Type
New Conventional
Estimated Equity
$333,955
Purchase Details
Closed on
Dec 8, 2005
Sold by
The Ranches At Stone Creek Llc
Bought by
Gonzales Fred E and Gonzales Kathryn G
Home Financials for this Owner
Home Financials are based on the most recent Mortgage that was taken out on this home.
Original Mortgage
$208,441
Interest Rate
6.14%
Mortgage Type
Purchase Money Mortgage
Create a Home Valuation Report for This Property
The Home Valuation Report is an in-depth analysis detailing your home's value as well as a comparison with similar homes in the area
Home Values in the Area
Average Home Value in this Area
Purchase History
| Date | Buyer | Sale Price | Title Company |
|---|---|---|---|
| Daw Owen B | -- | None Available | |
| Daw Owen B | -- | Novation Tiotle Ins Agcy | |
| Gonzales Kathryn G | -- | Novation Title Ins Agcy | |
| Gonzales Fred E | -- | Integrated Title Ins Service |
Source: Public Records
Mortgage History
| Date | Status | Borrower | Loan Amount |
|---|---|---|---|
| Open | Daw Owen B | $288,325 | |
| Previous Owner | Gonzales Fred E | $208,441 |
Source: Public Records
Tax History Compared to Growth
Tax History
| Year | Tax Paid | Tax Assessment Tax Assessment Total Assessment is a certain percentage of the fair market value that is determined by local assessors to be the total taxable value of land and additions on the property. | Land | Improvement |
|---|---|---|---|---|
| 2025 | $2,894 | $559,900 | $131,500 | $428,400 |
| 2024 | $2,894 | $556,900 | $126,500 | $430,400 |
| 2023 | $2,853 | $517,300 | $121,600 | $395,700 |
| 2022 | $2,975 | $530,800 | $119,200 | $411,600 |
| 2021 | $2,636 | $428,000 | $91,700 | $336,300 |
| 2020 | $2,500 | $381,000 | $84,400 | $296,600 |
| 2019 | $2,450 | $366,200 | $79,600 | $286,600 |
| 2018 | $2,273 | $336,900 | $79,600 | $257,300 |
| 2017 | $1,889 | $278,800 | $79,600 | $199,200 |
| 2016 | $1,699 | $235,600 | $83,600 | $152,000 |
| 2015 | $1,661 | $224,500 | $89,500 | $135,000 |
| 2014 | $1,617 | $215,200 | $86,700 | $128,500 |
Source: Public Records
Map
Nearby Homes
- 5189 W Dove Creek Ln
- 5298 W Icehouse Way
- 5183 W Swift Water Way
- 7908 Cold Stone Ln Unit N3
- 5422 W Island Creek Dr
- 4976 W Wood Spring Dr
- 8453 S Windmill Dr
- 7563 S Opal Mountain Way W Unit 306
- 7568 S Opal Mountain Way W Unit 316
- 7567 S Opal Mountain Way W Unit 307
- 7556 S Opal Mountain Way W Unit 311
- 7569 S Opal Mountain Way W Unit 308
- 7554 S Opal Mountain Way W Unit 310
- 7564 S Opal Mountain Way W Unit 314
- 7553 S Opal Mountain Way W Unit 302
- 6916 S Static Peak Dr
- 4678 Emmons Dr
- 7518 S 5720 W
- 7288 Comet Hill Cir
- 7903 Mckenzie Ln
- 5271 W Swift Water Way
- 5275 Swift Water Way
- 5263 W Swift Water Way
- 5263 Swift Water Way
- 5288 Ranches Loop Rd
- 5288 W Ranches Loop Rd
- 5296 Ranches Loop Rd
- 5296 W Ranches Loop Rd
- 5284 Ranches Loop Rd
- 5284 W Ranches Loop Rd Unit 310
- 5284 W Ranches Loop Rd
- 5257 Swift Water Way
- 5257 Swift Water Way Unit 302
- 5257 W Swift Water Way
- 5281 Swift Water Way
- 5248 Cool Water Way
- 5302 Ranches Loop Rd
- 5254 W Cool Water Way
- 5254 Cool Water Way
- 5302 W Ranches Loop Rd