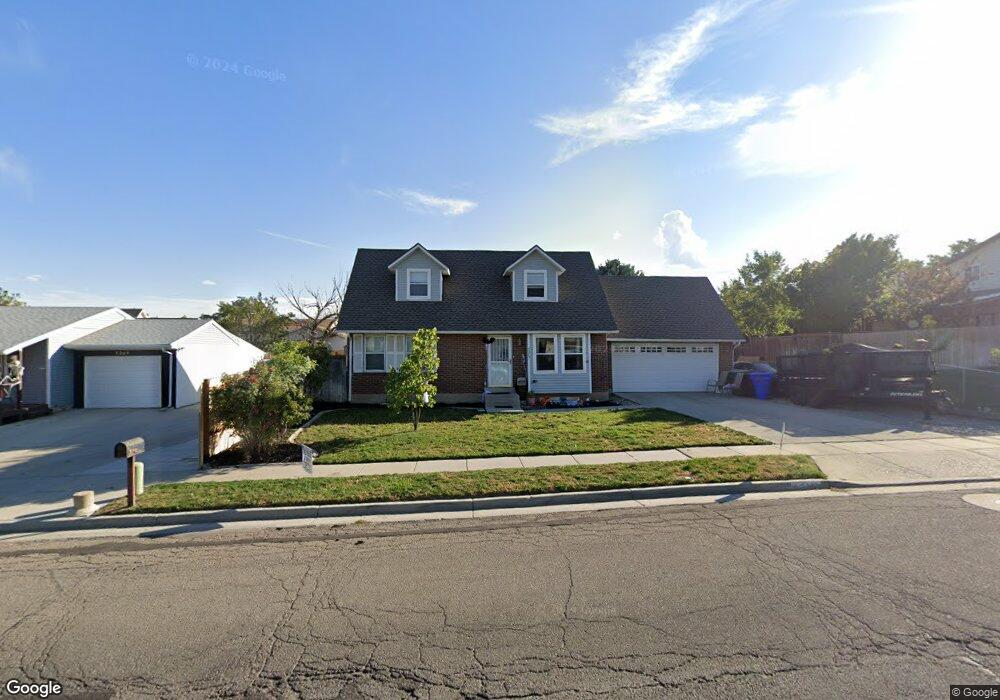
5273 W 6600 S West Jordan, UT 84081
Oquirrh NeighborhoodEstimated Value: $485,000 - $539,000
5
Beds
3
Baths
1,968
Sq Ft
$260/Sq Ft
Est. Value
About This Home
This home is located at 5273 W 6600 S, West Jordan, UT 84081 and is currently estimated at $510,714, approximately $259 per square foot. 5273 W 6600 S is a home located in Salt Lake County with nearby schools including Mountain Shadows School, West Hills Middle School, and Copper Hills High School.
Ownership History
Date
Name
Owned For
Owner Type
Purchase Details
Closed on
Nov 6, 2020
Sold by
Wineholt Shannon Neal and Sinoy Maria Rita
Bought by
Fong Rina and To Richard
Current Estimated Value
Home Financials for this Owner
Home Financials are based on the most recent Mortgage that was taken out on this home.
Original Mortgage
$268,125
Outstanding Balance
$238,593
Interest Rate
2.8%
Mortgage Type
New Conventional
Estimated Equity
$272,121
Purchase Details
Closed on
May 18, 2018
Sold by
Wineholt Shannon N and Sinoy Maria R
Bought by
Wineholt Shannon Neal and Apante Sin7oy Maria Rita
Purchase Details
Closed on
Jul 22, 2015
Sold by
Branca Lee B and Branca Janis L
Bought by
Wineholt Shannon N and Sinoy Maria R
Home Financials for this Owner
Home Financials are based on the most recent Mortgage that was taken out on this home.
Original Mortgage
$213,750
Interest Rate
4.01%
Mortgage Type
New Conventional
Create a Home Valuation Report for This Property
The Home Valuation Report is an in-depth analysis detailing your home's value as well as a comparison with similar homes in the area
Home Values in the Area
Average Home Value in this Area
Purchase History
| Date | Buyer | Sale Price | Title Company |
|---|---|---|---|
| Fong Rina | -- | Monument Title Insurance Co | |
| Wineholt Shannon Neal | -- | None Available | |
| Wineholt Shannon N | -- | Sutherland Title |
Source: Public Records
Mortgage History
| Date | Status | Borrower | Loan Amount |
|---|---|---|---|
| Open | Fong Rina | $268,125 | |
| Previous Owner | Wineholt Shannon N | $213,750 |
Source: Public Records
Tax History Compared to Growth
Tax History
| Year | Tax Paid | Tax Assessment Tax Assessment Total Assessment is a certain percentage of the fair market value that is determined by local assessors to be the total taxable value of land and additions on the property. | Land | Improvement |
|---|---|---|---|---|
| 2025 | $2,728 | $488,900 | $121,000 | $367,900 |
| 2024 | $2,728 | $461,200 | $114,100 | $347,100 |
| 2023 | $2,732 | $433,900 | $109,700 | $324,200 |
| 2022 | $2,709 | $427,700 | $107,600 | $320,100 |
| 2021 | $2,346 | $343,800 | $82,700 | $261,100 |
| 2020 | $2,187 | $299,400 | $82,700 | $216,700 |
| 2019 | $2,158 | $288,900 | $78,100 | $210,800 |
| 2018 | $1,988 | $262,600 | $78,100 | $184,500 |
| 2017 | $1,699 | $221,200 | $78,100 | $143,100 |
| 2016 | $1,669 | $204,400 | $78,100 | $126,300 |
| 2015 | $1,566 | $185,000 | $74,800 | $110,200 |
| 2014 | $1,529 | $177,500 | $72,400 | $105,100 |
Source: Public Records
Map
Nearby Homes
- 6568 S 5180 W
- 5183 W Cadenza Dr
- 5281 Saguaro Dr
- 6489 S Daffodil Way
- 6635 S Milfoil Cir
- 6706 Marshrock Rd
- 6839 S Cyclamen Dr
- 6853 Mullien Dr Unit 5420
- 5466 Ticklegrass Rd
- 6437 S Lobelia Dr
- 5557 W Joshua Cir
- 6398 S Lobelia Dr
- 4983 Shooting Star Ave
- 6928 Beargrass Rd
- 7758 S Iron Core Ln
- 7146 W Owens View Way Unit 204
- 7259 W Cibola Rd
- 4909 Sakura Ct
- 6922 Mullien Dr
- 5581 Bluevail Ct
- 5269 W 6600 S
- 6613 Clernates Dr
- 5276 W Cadenza Dr
- 5276 Cadenza Dr
- 5268 W Cadenza Dr
- 5268 Cadenza Dr
- 6629 Clernates Dr
- 5255 W 6600 S
- 5254 W Cadenza Dr
- 5254 Cadenza Dr
- 6591 Clernates Dr
- 5274 W 6600 S
- 5243 W 6600 S
- 6612 Clernates Dr
- 6612 S Clernates Dr
- 5242 W Cadenza Dr
- 5242 Cadenza Dr
- 5256 W 6600 S
- 6563 Clernates Cir
- 6585 Clernates Dr