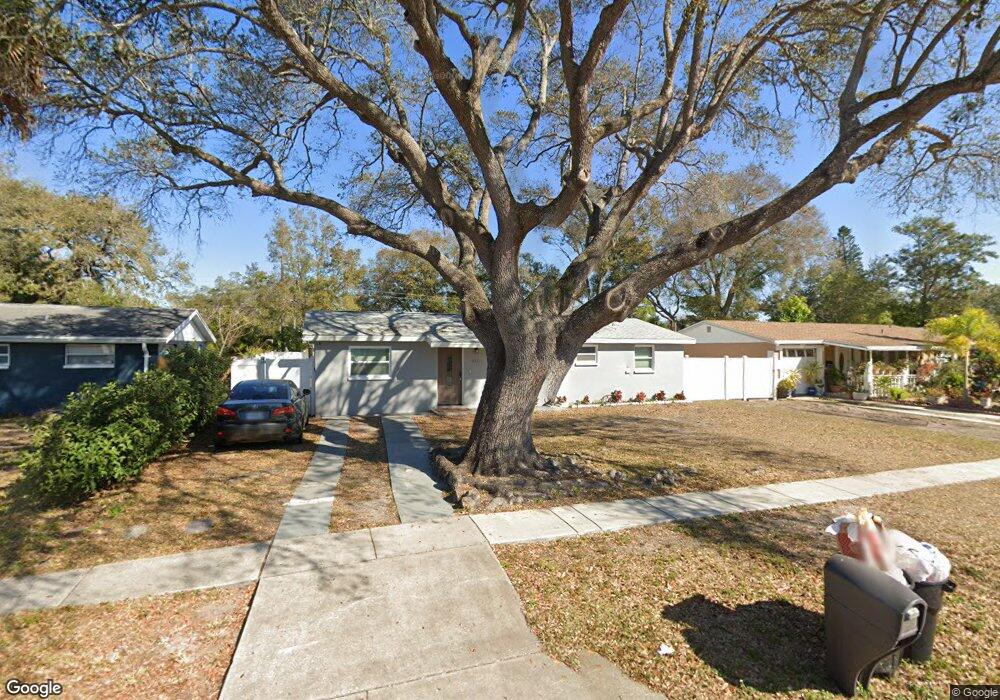
5275 86th Ave N Pinellas Park, FL 33782
Estimated Value: $316,000 - $388,000
--
Bed
6
Baths
1,125
Sq Ft
$316/Sq Ft
Est. Value
About This Home
This home is located at 5275 86th Ave N, Pinellas Park, FL 33782 and is currently estimated at $356,018, approximately $316 per square foot. 5275 86th Ave N is a home located in Pinellas County with nearby schools including Skyview Elementary School, Pinellas Park Middle School, and Hollins High School.
Ownership History
Date
Name
Owned For
Owner Type
Purchase Details
Closed on
May 18, 2021
Sold by
Baf 3 Llc
Bought by
Baf Assets 3 Llc
Current Estimated Value
Home Financials for this Owner
Home Financials are based on the most recent Mortgage that was taken out on this home.
Original Mortgage
$366,511,000
Outstanding Balance
$148,448,994
Interest Rate
2.9%
Mortgage Type
Commercial
Estimated Equity
-$148,092,976
Purchase Details
Closed on
Dec 31, 2020
Sold by
Sinanovic Gamil and Sinanuvic Raska
Bought by
Baf 3 Llc
Purchase Details
Closed on
May 16, 2018
Sold by
Close Mary Jean
Bought by
Sinanovic Camil and Sinanovic Salih
Purchase Details
Closed on
Dec 14, 1998
Sold by
Faust Carlon E and Faust Richard L
Bought by
Close Mark A
Home Financials for this Owner
Home Financials are based on the most recent Mortgage that was taken out on this home.
Original Mortgage
$62,220
Interest Rate
6.84%
Mortgage Type
VA
Create a Home Valuation Report for This Property
The Home Valuation Report is an in-depth analysis detailing your home's value as well as a comparison with similar homes in the area
Home Values in the Area
Average Home Value in this Area
Purchase History
| Date | Buyer | Sale Price | Title Company |
|---|---|---|---|
| Baf Assets 3 Llc | -- | Bchh Inc | |
| Baf 3 Llc | $259,900 | Bchh Inc | |
| Sinanovic Camil | $110,000 | Pineflas Park Title Company | |
| Close Mark A | $61,000 | -- |
Source: Public Records
Mortgage History
| Date | Status | Borrower | Loan Amount |
|---|---|---|---|
| Open | Baf Assets 3 Llc | $366,511,000 | |
| Previous Owner | Close Mark A | $65,683 | |
| Previous Owner | Close Mark A | $62,220 |
Source: Public Records
Tax History Compared to Growth
Tax History
| Year | Tax Paid | Tax Assessment Tax Assessment Total Assessment is a certain percentage of the fair market value that is determined by local assessors to be the total taxable value of land and additions on the property. | Land | Improvement |
|---|---|---|---|---|
| 2024 | $5,171 | $269,159 | $117,445 | $151,714 |
| 2023 | $5,171 | $254,449 | $108,816 | $145,633 |
| 2022 | $4,647 | $216,677 | $102,840 | $113,837 |
| 2021 | $3,916 | $177,062 | $0 | $0 |
| 2020 | $2,478 | $112,676 | $0 | $0 |
| 2019 | $2,287 | $103,222 | $0 | $0 |
| 2018 | $267 | $47,076 | $0 | $0 |
| 2017 | $255 | $46,108 | $0 | $0 |
| 2016 | $243 | $45,160 | $0 | $0 |
| 2015 | $244 | $44,846 | $0 | $0 |
| 2014 | $459 | $44,490 | $0 | $0 |
Source: Public Records
Map
Nearby Homes
- 5060 86th Ave
- 5301 82nd Ave N
- 8872 52nd Ln N
- 8897 54th St N
- 5431 82nd Ave N
- 8601 56th St N
- 8701 56th St N
- 8076 52nd Ln N
- 8795 56th St N
- 8848 56th Way N
- 5620 90th Ave N
- 4945 91st Ave N Unit 30
- 8501 47th St N
- 5825 81st Ave N
- 5710 92nd Terrace N
- 5380 77th Ave N
- 93267 Circle Dr Unit 267
- 5801 92nd Ave N
- 93195 2nd St Unit 195
- 7645 55th St N