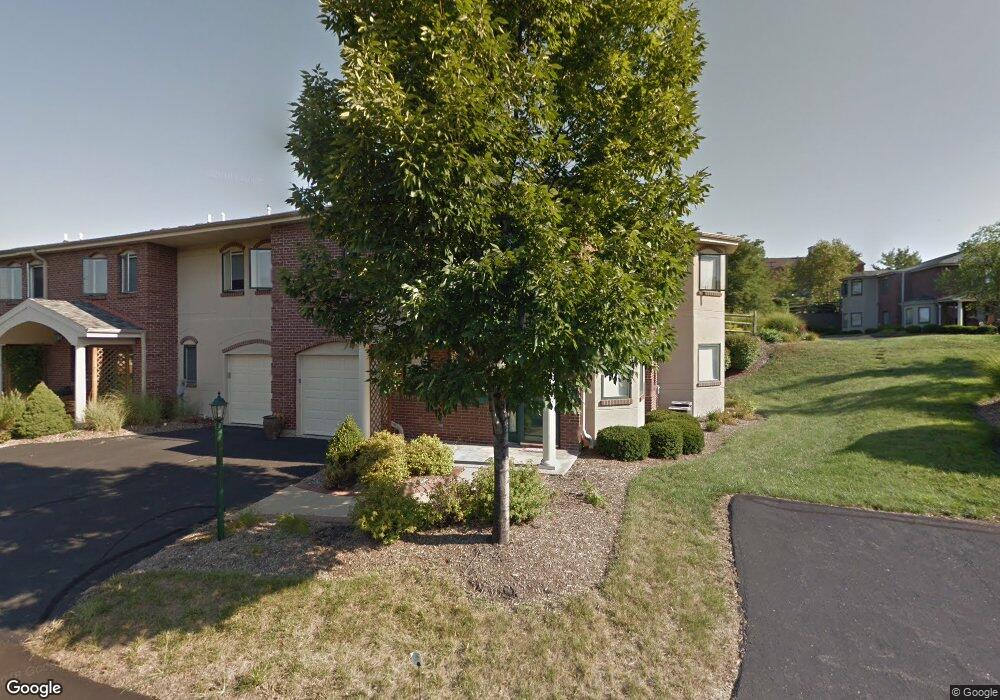
5275 Northbend Crossing Unit 55 Cincinnati, OH 45247
West Monfort Heights NeighborhoodEstimated Value: $219,000 - $224,000
2
Beds
2
Baths
1,252
Sq Ft
$177/Sq Ft
Est. Value
About This Home
This home is located at 5275 Northbend Crossing Unit 55, Cincinnati, OH 45247 and is currently estimated at $221,842, approximately $177 per square foot. 5275 Northbend Crossing Unit 55 is a home located in Hamilton County with nearby schools including Monfort Heights Elementary School, White Oak Middle School, and Colerain High School.
Ownership History
Date
Name
Owned For
Owner Type
Purchase Details
Closed on
Jun 23, 2021
Sold by
White Jackie Kennedy
Bought by
Jackson Karen Leigh and Jackson Mark A
Current Estimated Value
Purchase Details
Closed on
Sep 18, 2020
Sold by
Catucci Cynthia A
Bought by
White Jackie Kennedy
Purchase Details
Closed on
Jul 24, 2020
Sold by
Scholz Beth Ann
Bought by
Catucci Cynthia A
Purchase Details
Closed on
Apr 18, 2017
Sold by
Gehrich Geraldine
Bought by
Scholz Beth Ann
Purchase Details
Closed on
Dec 23, 2011
Sold by
Auciello Nancy
Bought by
Gehrich Geraldine
Purchase Details
Closed on
May 22, 2001
Sold by
S/Nbl Associates
Bought by
Treft Ruth Ann and Ruth Ann Treft Revocable Trust
Create a Home Valuation Report for This Property
The Home Valuation Report is an in-depth analysis detailing your home's value as well as a comparison with similar homes in the area
Home Values in the Area
Average Home Value in this Area
Purchase History
| Date | Buyer | Sale Price | Title Company |
|---|---|---|---|
| Jackson Karen Leigh | $181,500 | None Available | |
| White Jackie Kennedy | $165,000 | None Available | |
| Catucci Cynthia A | -- | Chicago Title Company Llc | |
| Scholz Beth Ann | -- | None Available | |
| Scholz Beth Ann | -- | -- | |
| Gehrich Geraldine | $115,500 | Attorney | |
| Treft Ruth Ann | $128,700 | -- |
Source: Public Records
Tax History Compared to Growth
Tax History
| Year | Tax Paid | Tax Assessment Tax Assessment Total Assessment is a certain percentage of the fair market value that is determined by local assessors to be the total taxable value of land and additions on the property. | Land | Improvement |
|---|---|---|---|---|
| 2024 | $3,365 | $63,525 | $10,325 | $53,200 |
| 2023 | $3,381 | $63,525 | $10,325 | $53,200 |
| 2022 | $2,641 | $40,520 | $8,012 | $32,508 |
| 2021 | $2,421 | $40,520 | $8,012 | $32,508 |
| 2020 | $2,445 | $40,520 | $8,012 | $32,508 |
| 2019 | $2,476 | $37,174 | $7,350 | $29,824 |
| 2018 | $2,205 | $37,174 | $7,350 | $29,824 |
| 2017 | $2,083 | $37,174 | $7,350 | $29,824 |
| 2016 | $2,299 | $40,426 | $6,395 | $34,031 |
| 2015 | $2,320 | $40,426 | $6,395 | $34,031 |
| 2014 | $2,324 | $40,426 | $6,395 | $34,031 |
| 2013 | $2,279 | $42,385 | $7,350 | $35,035 |
Source: Public Records
Map
Nearby Homes
- 5440 Asbury Lake Dr
- 5476 Audro Dr
- 3775 Boomer Rd
- 4491 W Fork Rd
- 3731 Ridgedale Dr
- 4201 Boomer Rd
- 5538 Silverpoint Dr
- Carrington Plan at Ivy Rose - Designer Collection
- Winston Plan at Ivy Rose - Designer Collection
- Calvin Plan at Ivy Rose - Designer Collection
- Miles Plan at Ivy Rose - Designer Collection
- Blair Plan at Ivy Rose - Designer Collection
- Magnolia Plan at Ivy Rose - Designer Collection
- Grandin Plan at Ivy Rose - Designer Collection
- Wyatt Plan at Ivy Rose - Designer Collection
- Avery Plan at Ivy Rose - Designer Collection
- Charles Plan at Ivy Rose - Designer Collection
- 4575 Boomer Rd
- 4628 Boomer Rd
- 5121 Rowan Dr
- 5273 Northbend Crossing Unit 56
- 5325 Northbend Crossing Unit 53
- 5323 Northbend Crossing Unit 52
- 5327 Northbend Crossing Unit 54
- 5325 Northbend Crossing
- 5273 N Bend Crossing
- 5321 Northbend Crossing Unit 51
- 5323 N Bend Crossing
- 5271 Northbend Crossing Unit 57
- 5327 N Bend Crossing
- 5275 N Bend Crossing
- 5261 Northbend Crossing Unit 91
- 5251 N Bend Crossing
- 5261 N Bend Crossing
- 5263 Northbend Crossing Unit 92
- 5191 Northbend Crossing
- 5193 N Bend Crossing
- 5263 Northbend Crossing
- 5193 N Bend Crossing Unit 9-3
- 5201 Northbend Crossing