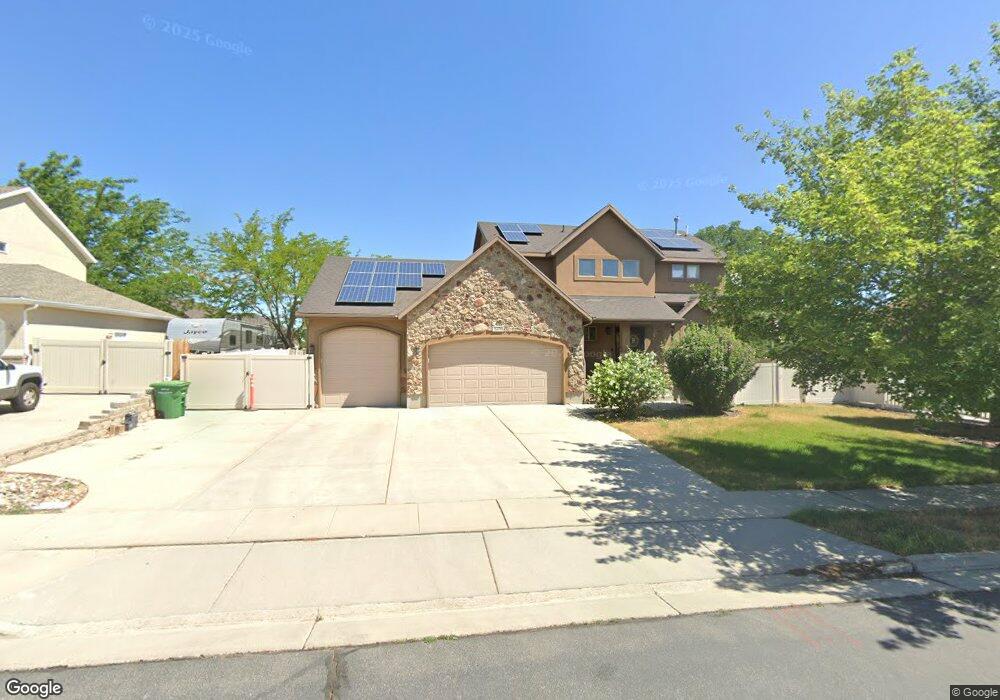
5276 W 8180 S West Jordan, UT 84081
Cobble Creek NeighborhoodEstimated Value: $624,000 - $678,000
3
Beds
3
Baths
2,944
Sq Ft
$220/Sq Ft
Est. Value
About This Home
This home is located at 5276 W 8180 S, West Jordan, UT 84081 and is currently estimated at $649,130, approximately $220 per square foot. 5276 W 8180 S is a home located in Salt Lake County with nearby schools including Hayden Peak Elementary School, West Hills Middle School, and Copper Hills High School.
Ownership History
Date
Name
Owned For
Owner Type
Purchase Details
Closed on
Mar 30, 2021
Sold by
Blanton James F and Blanton Jacqueline R
Bought by
Blanton James Franklin and Blanton Jacqueline R
Current Estimated Value
Purchase Details
Closed on
Mar 29, 2012
Sold by
Lim Brandee L
Bought by
Blanton James F and Blanton Jacqueline R
Home Financials for this Owner
Home Financials are based on the most recent Mortgage that was taken out on this home.
Original Mortgage
$186,120
Outstanding Balance
$24,011
Interest Rate
3.13%
Mortgage Type
New Conventional
Estimated Equity
$625,119
Purchase Details
Closed on
Dec 11, 2003
Sold by
Desert Point Builders Inc
Bought by
Lim Brandee L
Home Financials for this Owner
Home Financials are based on the most recent Mortgage that was taken out on this home.
Original Mortgage
$253,650
Interest Rate
5.92%
Mortgage Type
Purchase Money Mortgage
Purchase Details
Closed on
Sep 9, 2003
Sold by
Kfp Corp
Bought by
Desert Point Builders
Create a Home Valuation Report for This Property
The Home Valuation Report is an in-depth analysis detailing your home's value as well as a comparison with similar homes in the area
Home Values in the Area
Average Home Value in this Area
Purchase History
| Date | Buyer | Sale Price | Title Company |
|---|---|---|---|
| Blanton James Franklin | -- | None Available | |
| Blanton James F | -- | Title West | |
| Lim Brandee L | -- | Meridian Title | |
| Desert Point Builders | -- | Meridian Title |
Source: Public Records
Mortgage History
| Date | Status | Borrower | Loan Amount |
|---|---|---|---|
| Open | Blanton James F | $186,120 | |
| Previous Owner | Lim Brandee L | $253,650 |
Source: Public Records
Tax History Compared to Growth
Tax History
| Year | Tax Paid | Tax Assessment Tax Assessment Total Assessment is a certain percentage of the fair market value that is determined by local assessors to be the total taxable value of land and additions on the property. | Land | Improvement |
|---|---|---|---|---|
| 2025 | $3,165 | $618,000 | $155,900 | $462,100 |
| 2024 | $3,165 | $609,000 | $149,900 | $459,100 |
| 2023 | $3,029 | $549,200 | $144,200 | $405,000 |
| 2022 | $3,171 | $565,700 | $141,400 | $424,300 |
| 2021 | $2,803 | $455,200 | $108,800 | $346,400 |
| 2020 | $2,665 | $406,100 | $100,000 | $306,100 |
| 2019 | $2,638 | $394,200 | $94,400 | $299,800 |
| 2018 | $2,447 | $362,700 | $94,400 | $268,300 |
| 2017 | $2,349 | $346,600 | $94,400 | $252,200 |
| 2016 | $2,122 | $294,200 | $99,100 | $195,100 |
| 2015 | $2,176 | $294,200 | $106,200 | $188,000 |
| 2014 | $2,120 | $282,200 | $102,800 | $179,400 |
Source: Public Records
Map
Nearby Homes
- 5422 W Island Creek Dr
- 5298 W Icehouse Way
- 5183 W Swift Water Way
- 5189 W Dove Creek Ln
- 8453 S Windmill Dr
- 7908 Cold Stone Ln Unit N3
- 8577 Autumn Gold Cir
- 7903 Mckenzie Ln
- 7886 Mckenzie Ln
- 4887 W 8620 S
- 8769 S 5130 W
- 4976 W Wood Spring Dr
- 5527 W Caliente Dr
- 4678 Emmons Dr
- 4839 W 8620 S
- 8314 Etude Dr
- 8793 S Big Bar Ct
- 8359 Etude Dr
- 5958 W 8100 S
- 8854 Rocky Creek Dr
- 5286 W 8180 S
- 5288 W 8180 S
- 5262 W 8180 S
- 5262 W 8180 So
- 5277 W Amethyst Dr
- 5263 Amethyst Dr
- 5263 W Amethyst Dr
- 5277 Amethyst Dr
- 5271 W 8180 S
- 5283 W 8180 S
- 5291 Amethyst Dr
- 5248 W 8180 S
- 5304 W 8180 S
- 5242 W 8180 S
- 5259 W 8180 S
- 5293 W 8180 S
- 5249 W Amethyst Dr
- 5307 W 8180 S
- 5272 W 8230 S
- 5241 W 8180 S