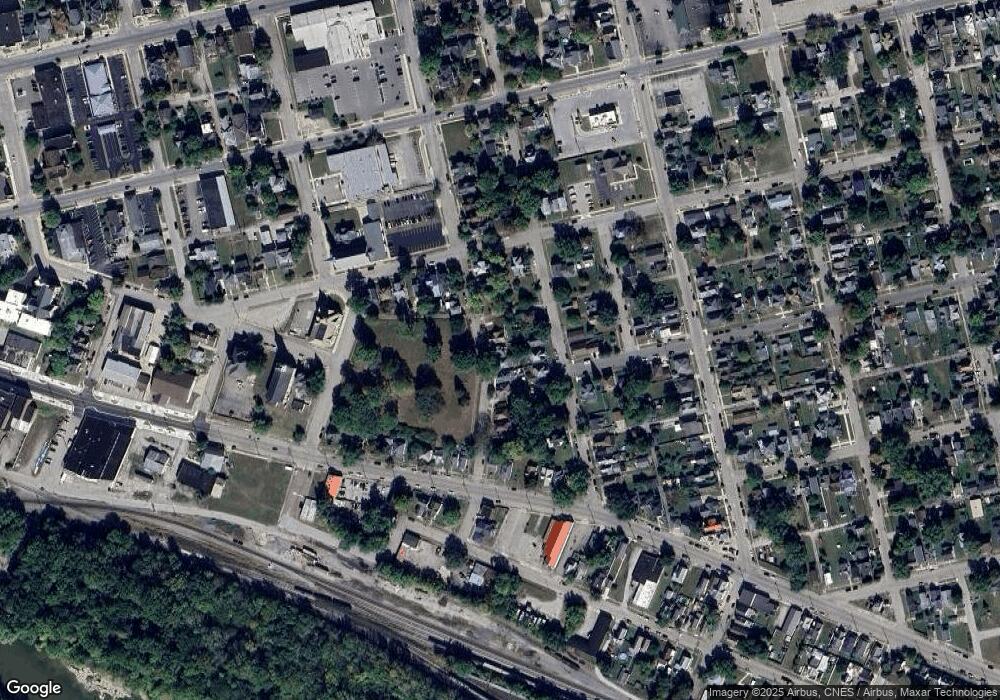
528 10th St Logansport, IN 46947
Estimated Value: $89,000 - $127,225
3
Beds
1
Bath
1,155
Sq Ft
$89/Sq Ft
Est. Value
About This Home
This home is located at 528 10th St, Logansport, IN 46947 and is currently estimated at $102,556, approximately $88 per square foot. 528 10th St is a home located in Cass County with nearby schools including Logansport Community High School and All Saints Catholic School.
Ownership History
Date
Name
Owned For
Owner Type
Purchase Details
Closed on
May 2, 2025
Sold by
Davis Summer and Davis Chad
Bought by
Davis Chad and Davis Summer
Current Estimated Value
Home Financials for this Owner
Home Financials are based on the most recent Mortgage that was taken out on this home.
Original Mortgage
$70,400
Outstanding Balance
$69,831
Interest Rate
6.65%
Mortgage Type
New Conventional
Estimated Equity
$32,725
Purchase Details
Closed on
Dec 19, 2023
Sold by
Donnelly Michelle
Bought by
Johnson Summer and Davis Chad
Purchase Details
Closed on
Feb 14, 2023
Sold by
Hensel Debra S
Bought by
Donnelly Michelle
Create a Home Valuation Report for This Property
The Home Valuation Report is an in-depth analysis detailing your home's value as well as a comparison with similar homes in the area
Home Values in the Area
Average Home Value in this Area
Purchase History
| Date | Buyer | Sale Price | Title Company |
|---|---|---|---|
| Davis Chad | -- | None Listed On Document | |
| Johnson Summer | -- | None Listed On Document | |
| Donnelly Michelle | -- | None Listed On Document |
Source: Public Records
Mortgage History
| Date | Status | Borrower | Loan Amount |
|---|---|---|---|
| Open | Davis Chad | $70,400 |
Source: Public Records
Tax History Compared to Growth
Tax History
| Year | Tax Paid | Tax Assessment Tax Assessment Total Assessment is a certain percentage of the fair market value that is determined by local assessors to be the total taxable value of land and additions on the property. | Land | Improvement |
|---|---|---|---|---|
| 2024 | $924 | $49,300 | $5,400 | $43,900 |
| 2022 | $804 | $39,300 | $5,400 | $33,900 |
| 2021 | $733 | $35,800 | $5,400 | $30,400 |
| 2020 | $663 | $32,200 | $5,400 | $26,800 |
| 2019 | $641 | $31,100 | $5,400 | $25,700 |
| 2018 | $646 | $30,700 | $5,400 | $25,300 |
| 2017 | $641 | $30,400 | $6,400 | $24,000 |
| 2016 | $597 | $28,200 | $6,400 | $21,800 |
| 2014 | $655 | $31,100 | $6,400 | $24,700 |
| 2013 | $655 | $31,600 | $6,400 | $25,200 |
Source: Public Records
Map
Nearby Homes