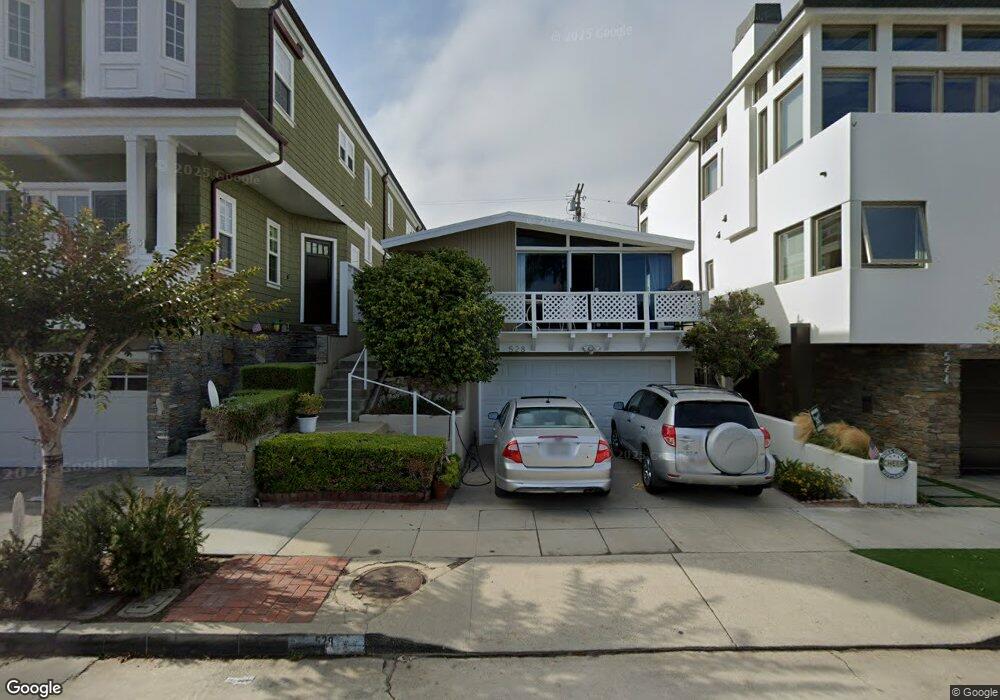
528 3rd St Manhattan Beach, CA 90266
Estimated Value: $2,292,951 - $3,492,000
4
Beds
2
Baths
1,416
Sq Ft
$2,245/Sq Ft
Est. Value
About This Home
This home is located at 528 3rd St, Manhattan Beach, CA 90266 and is currently estimated at $3,178,988, approximately $2,245 per square foot. 528 3rd St is a home located in Los Angeles County with nearby schools including Opal Robinson Elementary School, Manhattan Beach Middle School, and Mira Costa High School.
Ownership History
Date
Name
Owned For
Owner Type
Purchase Details
Closed on
Dec 7, 2006
Sold by
Sorensen Shauna Elaine and Sorensen Shauna E
Bought by
Sorensen Shauna E and Shauna E Sorensen Revocable Trust
Current Estimated Value
Purchase Details
Closed on
Oct 8, 2001
Sold by
Bear Dixie Lou and Bear Dixie L
Bought by
Bear Ted L
Purchase Details
Closed on
Apr 11, 2000
Sold by
Bear Ted L
Bought by
Bear Dixie Lou
Purchase Details
Closed on
Apr 7, 2000
Sold by
Sorensen Stephen Douglas and Sorensen Christine
Bought by
Sorensen Shauna Elaine
Purchase Details
Closed on
Jan 28, 1999
Sold by
Rosetta L Sorensen Trust and Shauna Elaine
Bought by
Bear Dixie Lou
Create a Home Valuation Report for This Property
The Home Valuation Report is an in-depth analysis detailing your home's value as well as a comparison with similar homes in the area
Home Values in the Area
Average Home Value in this Area
Purchase History
| Date | Buyer | Sale Price | Title Company |
|---|---|---|---|
| Sorensen Shauna E | -- | None Available | |
| Bear Ted L | -- | -- | |
| Bear Dixie Lou | -- | Provident Title Company | |
| Sorensen Shauna Elaine | $195,500 | Provident Title Company | |
| Bear Dixie Lou | -- | -- | |
| Bear Dixie Lou | -- | -- |
Source: Public Records
Tax History
| Year | Tax Paid | Tax Assessment Tax Assessment Total Assessment is a certain percentage of the fair market value that is determined by local assessors to be the total taxable value of land and additions on the property. | Land | Improvement |
|---|---|---|---|---|
| 2025 | $5,500 | $447,818 | $251,534 | $196,284 |
| 2024 | $5,500 | $439,038 | $246,602 | $192,436 |
| 2023 | $5,312 | $430,430 | $241,767 | $188,663 |
| 2022 | $5,227 | $421,991 | $237,027 | $184,964 |
| 2021 | $5,190 | $413,718 | $232,380 | $181,338 |
| 2020 | $5,144 | $409,477 | $229,998 | $179,479 |
| 2019 | $5,059 | $401,449 | $225,489 | $175,960 |
| 2018 | $4,929 | $393,578 | $221,068 | $172,510 |
| 2016 | $4,416 | $378,297 | $212,485 | $165,812 |
| 2015 | $4,327 | $372,616 | $209,294 | $163,322 |
| 2014 | $4,276 | $365,318 | $205,195 | $160,123 |
Source: Public Records
Map
Nearby Homes
- 436 1st St
- 98 Highland Ave
- 212 Manhattan Ave
- 89 Bayview Dr
- 621 6th St
- 109 S Poinsettia Ave
- 215 S Poinsettia Ave
- 121 35th St
- 231 Longfellow Ave
- 500 N Poinsettia Ave
- 626 Longfellow Ave
- 921 Highland Ave
- 337 10th St
- 920 The Strand
- 1000 The Strand
- 124 11th St
- 927 9th St
- 525 Manhattan Beach Blvd
- 1140 Fisher Ave
- 2965 La Carlita St
Your Personal Tour Guide
Ask me questions while you tour the home.