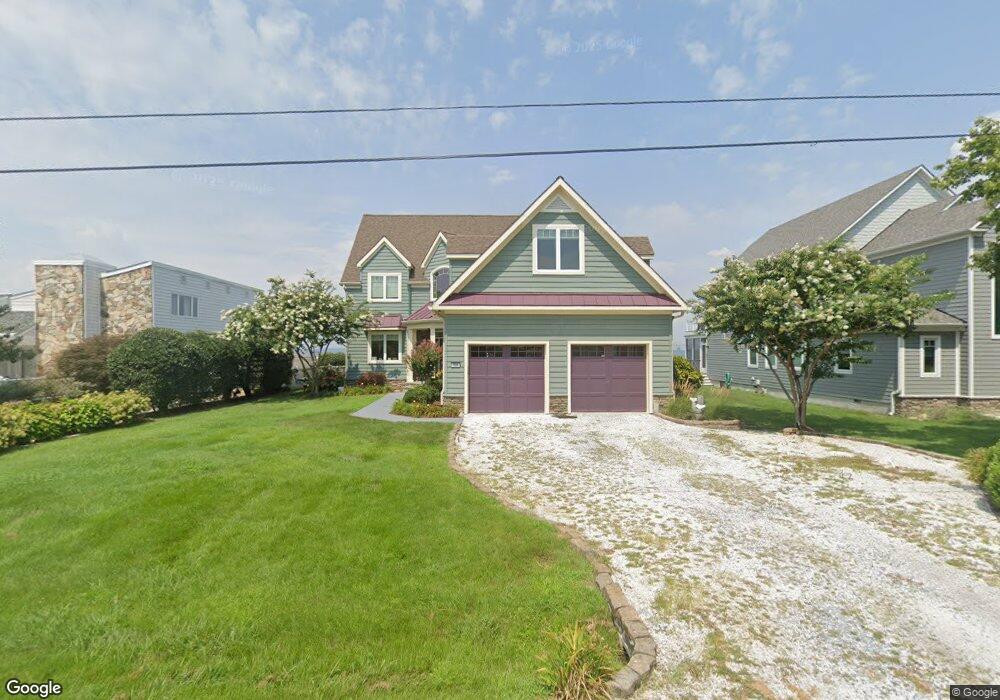
528 Bayside Dr Stevensville, MD 21666
Estimated Value: $1,192,000 - $1,900,000
--
Bed
2
Baths
3,642
Sq Ft
$443/Sq Ft
Est. Value
About This Home
This home is located at 528 Bayside Dr, Stevensville, MD 21666 and is currently estimated at $1,615,215, approximately $443 per square foot. 528 Bayside Dr is a home located in Queen Anne's County with nearby schools including Matapeake Elementary School, Matapeake Middle School, and Kent Island High School.
Ownership History
Date
Name
Owned For
Owner Type
Purchase Details
Closed on
Oct 30, 2007
Sold by
Speer Mary F Life Estate
Bought by
Snyder Ellsworth F and Snyder Jeanne M
Current Estimated Value
Home Financials for this Owner
Home Financials are based on the most recent Mortgage that was taken out on this home.
Original Mortgage
$153,000
Outstanding Balance
$105,980
Interest Rate
8.5%
Mortgage Type
Purchase Money Mortgage
Estimated Equity
$1,509,235
Purchase Details
Closed on
Oct 15, 2007
Sold by
Speer Mary F Life Estate
Bought by
Snyder Ellsworth F and Snyder Jeanne M
Home Financials for this Owner
Home Financials are based on the most recent Mortgage that was taken out on this home.
Original Mortgage
$153,000
Outstanding Balance
$105,980
Interest Rate
8.5%
Mortgage Type
Purchase Money Mortgage
Estimated Equity
$1,509,235
Create a Home Valuation Report for This Property
The Home Valuation Report is an in-depth analysis detailing your home's value as well as a comparison with similar homes in the area
Home Values in the Area
Average Home Value in this Area
Purchase History
| Date | Buyer | Sale Price | Title Company |
|---|---|---|---|
| Snyder Ellsworth F | $600,000 | -- | |
| Snyder Ellsworth F | $600,000 | -- |
Source: Public Records
Mortgage History
| Date | Status | Borrower | Loan Amount |
|---|---|---|---|
| Open | Snyder Ellsworth F | $153,000 | |
| Open | Snyder Ellsworth F | $417,000 | |
| Closed | Snyder Ellsworth F | $153,000 | |
| Closed | Snyder Ellsworth F | $417,000 |
Source: Public Records
Tax History Compared to Growth
Tax History
| Year | Tax Paid | Tax Assessment Tax Assessment Total Assessment is a certain percentage of the fair market value that is determined by local assessors to be the total taxable value of land and additions on the property. | Land | Improvement |
|---|---|---|---|---|
| 2025 | $9,507 | $1,099,300 | $0 | $0 |
| 2024 | $9,001 | $1,002,100 | $0 | $0 |
| 2023 | $8,524 | $904,900 | $422,400 | $482,500 |
| 2022 | $8,150 | $865,167 | $0 | $0 |
| 2021 | $7,536 | $825,433 | $0 | $0 |
| 2020 | $7,536 | $785,700 | $352,400 | $433,300 |
| 2019 | $7,536 | $785,700 | $352,400 | $433,300 |
| 2018 | $7,536 | $785,700 | $352,400 | $433,300 |
| 2017 | $8,453 | $881,300 | $0 | $0 |
| 2016 | -- | $881,300 | $0 | $0 |
| 2015 | $5,270 | $881,300 | $0 | $0 |
| 2014 | $5,270 | $1,028,700 | $0 | $0 |
Source: Public Records
Map
Nearby Homes
- 802 Broadcreek Dr
- 312 William Way
- 412 Bay City Rd
- 418 Bay City Rd
- 410 Stafford Rd
- 306 Irene Way
- 526 Victoria Dr
- 103 Irene Way
- 914 Chesapeake Dr
- 1000 Chesapeake Dr
- 0 Sunset Wharf Lot D-3 Unit MDQA2010280
- 0 Sunset Wharf Lot D-1 Unit MDQA2010276
- 298 Moorings Cir
- 312 Topside Dr Unit 223
- 349 Topside Dr
- 858 Moorings Cir Unit 11
- 736 Moorings Cir Unit 35
- 119 Keenan Way
- 111 Keenan Way
- 241 Jessica Lyn Ave