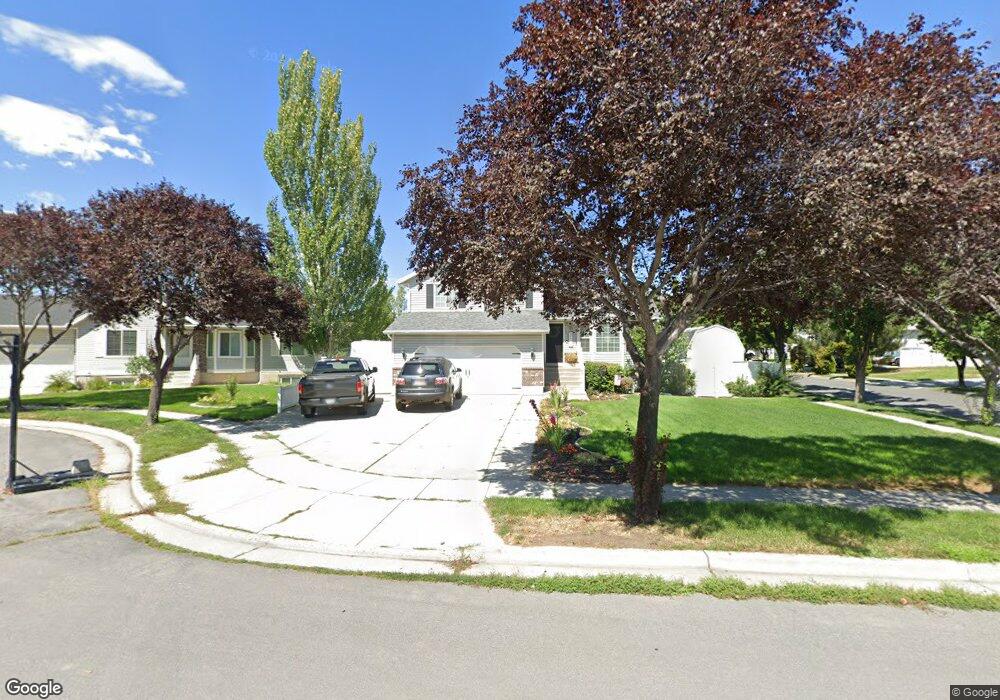
528 Daniel Ct Salt Lake City, UT 84123
Estimated Value: $540,000 - $570,139
4
Beds
2
Baths
1,864
Sq Ft
$299/Sq Ft
Est. Value
About This Home
This home is located at 528 Daniel Ct, Salt Lake City, UT 84123 and is currently estimated at $557,785, approximately $299 per square foot. 528 Daniel Ct is a home located in Salt Lake County with nearby schools including Grant Elementary School, Riverview Junior High School, and Murray High School.
Ownership History
Date
Name
Owned For
Owner Type
Purchase Details
Closed on
Aug 30, 2013
Sold by
Duncan Corey L and Duncan Jenni R
Bought by
Duncan Corey Lynn and Duncan Jenni Rae
Current Estimated Value
Home Financials for this Owner
Home Financials are based on the most recent Mortgage that was taken out on this home.
Original Mortgage
$209,446
Outstanding Balance
$151,457
Interest Rate
3.79%
Mortgage Type
New Conventional
Estimated Equity
$406,328
Purchase Details
Closed on
Jul 16, 2013
Sold by
Bytheway Benjamin D and Bytheway Amanda M
Bought by
Duncan Corey L and Duncan Jenni R
Home Financials for this Owner
Home Financials are based on the most recent Mortgage that was taken out on this home.
Original Mortgage
$209,446
Outstanding Balance
$151,457
Interest Rate
3.79%
Mortgage Type
New Conventional
Estimated Equity
$406,328
Purchase Details
Closed on
Nov 14, 2005
Sold by
Jones James B and Jones Elizabeth
Bought by
Bytheway Benjamin D and Bytheway Amanda M
Home Financials for this Owner
Home Financials are based on the most recent Mortgage that was taken out on this home.
Original Mortgage
$30,000
Interest Rate
5.93%
Mortgage Type
Stand Alone Second
Purchase Details
Closed on
Feb 18, 2004
Sold by
Hud
Bought by
Jones James B and Jones Elizabeth
Home Financials for this Owner
Home Financials are based on the most recent Mortgage that was taken out on this home.
Original Mortgage
$137,465
Interest Rate
3.87%
Mortgage Type
Purchase Money Mortgage
Purchase Details
Closed on
Oct 15, 2003
Sold by
Wells Fargo Home Mortgage Inc
Bought by
Hud
Purchase Details
Closed on
Oct 14, 2003
Sold by
Mcguire Richard E
Bought by
Wells Fargo Home Mortgage Inc
Purchase Details
Closed on
May 26, 1999
Sold by
Sartori Mary E
Bought by
Mcguire Richard E
Home Financials for this Owner
Home Financials are based on the most recent Mortgage that was taken out on this home.
Original Mortgage
$149,368
Interest Rate
6.86%
Mortgage Type
FHA
Purchase Details
Closed on
Feb 21, 1997
Sold by
Waldenwood Homes Inc
Bought by
Sartori Mary E
Home Financials for this Owner
Home Financials are based on the most recent Mortgage that was taken out on this home.
Original Mortgage
$93,100
Interest Rate
7.85%
Mortgage Type
Purchase Money Mortgage
Purchase Details
Closed on
Jul 23, 1996
Sold by
Winchester L L C
Bought by
Waldenwood Homes Inc
Home Financials for this Owner
Home Financials are based on the most recent Mortgage that was taken out on this home.
Original Mortgage
$99,000
Interest Rate
8.39%
Mortgage Type
Construction
Create a Home Valuation Report for This Property
The Home Valuation Report is an in-depth analysis detailing your home's value as well as a comparison with similar homes in the area
Home Values in the Area
Average Home Value in this Area
Purchase History
| Date | Buyer | Sale Price | Title Company |
|---|---|---|---|
| Duncan Corey Lynn | -- | None Available | |
| Duncan Corey L | -- | Bonneville Superior Title | |
| Bytheway Benjamin D | -- | Equity Title | |
| Jones James B | -- | Monument Title Ins Co | |
| Hud | -- | Backman Stewart Title Svcs | |
| Wells Fargo Home Mortgage Inc | $165,485 | Backman Stewart Title Svcs | |
| Mcguire Richard E | -- | Brighton Title | |
| Sartori Mary E | -- | -- | |
| Waldenwood Homes Inc | -- | First American Title |
Source: Public Records
Mortgage History
| Date | Status | Borrower | Loan Amount |
|---|---|---|---|
| Open | Duncan Corey L | $209,446 | |
| Previous Owner | Bytheway Benjamin D | $30,000 | |
| Previous Owner | Bytheway Benjamin D | $160,000 | |
| Previous Owner | Jones James B | $137,465 | |
| Previous Owner | Mcguire Richard E | $149,368 | |
| Previous Owner | Sartori Mary E | $93,100 | |
| Previous Owner | Waldenwood Homes Inc | $99,000 |
Source: Public Records
Tax History Compared to Growth
Tax History
| Year | Tax Paid | Tax Assessment Tax Assessment Total Assessment is a certain percentage of the fair market value that is determined by local assessors to be the total taxable value of land and additions on the property. | Land | Improvement |
|---|---|---|---|---|
| 2025 | $2,308 | $525,600 | $160,700 | $364,900 |
| 2024 | $2,308 | $511,900 | $150,200 | $361,700 |
| 2023 | $2,278 | $484,000 | $142,800 | $341,200 |
| 2022 | $2,420 | $488,800 | $140,000 | $348,800 |
| 2021 | $2,085 | $371,300 | $130,000 | $241,300 |
| 2020 | $1,983 | $334,300 | $92,000 | $242,300 |
| 2019 | $1,908 | $310,700 | $92,000 | $218,700 |
| 2018 | $1,716 | $285,100 | $92,000 | $193,100 |
| 2017 | $1,617 | $270,900 | $84,000 | $186,900 |
| 2016 | $1,596 | $258,100 | $84,000 | $174,100 |
| 2015 | $1,612 | $236,800 | $81,500 | $155,300 |
| 2014 | $1,553 | $226,300 | $79,000 | $147,300 |
Source: Public Records
Map
Nearby Homes
- 1216 W Winchester St
- 6433 S 790 W
- 6438 S 840 W
- 234 Waterstone Cir Unit 9
- 6816 S Snickers Ln
- 6556 S Jefferson St Unit 15
- 6938 S Zandi Dr
- Crawford Plan at Waterstone
- Matisse Plan at Waterstone
- Bellows Plan at Waterstone
- Sargent Plan at Waterstone
- 649 Bulldog Cir
- 868 W Wynwood Park Dr
- 6571 S Jefferson St
- 165 W Winchester St
- 6556 S 130 W Unit LOT 8
- 6558 S 130 W Unit LOT 7
- 6564 S 130 W Unit LOT 6
- 145 W Winchester St
- 115 W Lester Ave
- 528 W Daniel Ct
- 534 W Daniel Ct
- 6598 Daniel Way
- 6578 Daniel Way
- 6591 Daniel Way
- 6591 S Daniel Way
- 6607 Daniel Way
- 527 W 6570 S
- 6581 Daniel Way
- 6617 Daniel Way
- 541 W 6570 S
- 6617 S Daniel Way
- 6622 Daniel Way
- 6668 Daniel Way
- 548 Daniel Ct
- 554 Daniel Ct
- 549 Daniel Ct
- 6573 Daniel Way
- 6569 S 520 W
- 557 W 6570 S