
528 E 3rd St Unit 3 Boston, MA 02127
South Boston Neighborhood
1
Bed
1
Bath
700
Sq Ft
871
Sq Ft Lot
About This Home
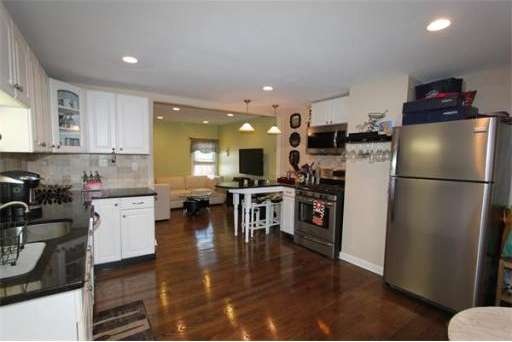
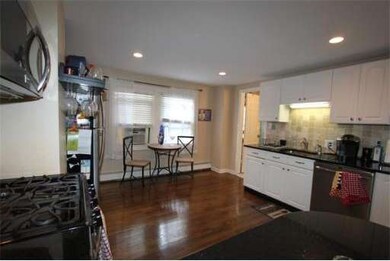
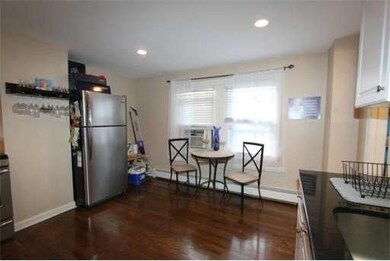
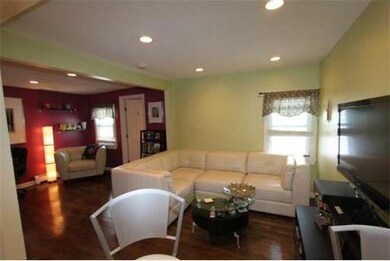
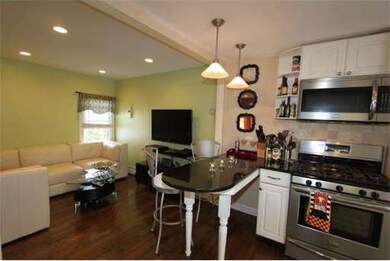
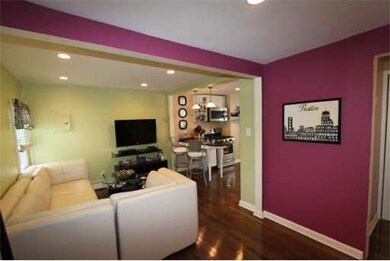
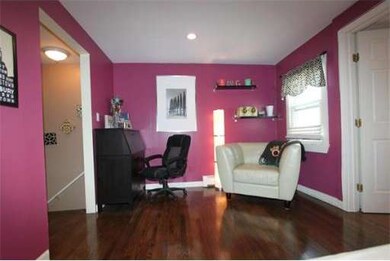
As of October 2020Move right in to this Sunny EAST SIDE Penthouse unit with gleaming hardwood floor and loads of space and character!! Close to TRENDY East Broadway shops & transportation. Spacious open floor plan offers a large eat in kitchen complete w/breakfast bar, granite, & SS appliances; large living room, updated ceramic tile bath. King sized bedroom with two double closets! Espresso stained floors, recessed lights, great closet space, small private mud room entrance way, HUGE storage & w/d in the basement. Unit comes w/roof rights. Pet Friendly and strong owner occupied condo association.
Property Details
Home Type
Condominium
Est. Annual Taxes
$5,730
Year Built
1890
Lot Details
0
Listing Details
- Unit Level: 3
- Unit Placement: Top/Penthouse
- Special Features: None
- Property Sub Type: Condos
- Year Built: 1890
Interior Features
- Has Basement: Yes
- Number of Rooms: 3
Garage/Parking
- Parking Spaces: 0
Condo/Co-op/Association
- Association Fee Includes: Water, Sewer, Master Insurance
- Pets Allowed: Yes
- No Units: 3
- Unit Building: 3
Ownership History
Date
Name
Owned For
Owner Type
Purchase Details
Listed on
Aug 11, 2020
Closed on
Oct 1, 2020
Sold by
Thomas Lauren and Thomas Burke
Bought by
Foley Melanie L
Seller's Agent
Shannon Rideout
Waterfront Realty Group
Buyer's Agent
Adriano Varano
Keller Williams Realty
List Price
$519,000
Sold Price
$505,000
Premium/Discount to List
-$14,000
-2.7%
Current Estimated Value
Home Financials for this Owner
Home Financials are based on the most recent Mortgage that was taken out on this home.
Estimated Appreciation
$56,751
Avg. Annual Appreciation
2.25%
Original Mortgage
$454,500
Outstanding Balance
$408,795
Interest Rate
2.9%
Mortgage Type
New Conventional
Estimated Equity
$152,956
Purchase Details
Listed on
Oct 21, 2015
Closed on
May 6, 2016
Sold by
Schulte Laura K
Bought by
Burke Palozej Lauren and Burke Thomas
Seller's Agent
Lisa Loveland
Keller Williams Realty Boston-Metro | South End
Buyer's Agent
Everett Palozej
William Raveis R.E. & Home Services
List Price
$429,000
Sold Price
$382,500
Premium/Discount to List
-$46,500
-10.84%
Home Financials for this Owner
Home Financials are based on the most recent Mortgage that was taken out on this home.
Avg. Annual Appreciation
6.47%
Original Mortgage
$363,375
Interest Rate
3.71%
Mortgage Type
New Conventional
Purchase Details
Listed on
Oct 8, 2014
Closed on
Jan 30, 2015
Sold by
Gaulien Andrea
Bought by
Schulte Laura K
Seller's Agent
Bryan McNeill
RE/MAX Realty Plus
Buyer's Agent
Lisa Loveland
Keller Williams Realty Boston-Metro | South End
List Price
$359,000
Sold Price
$355,000
Premium/Discount to List
-$4,000
-1.11%
Home Financials for this Owner
Home Financials are based on the most recent Mortgage that was taken out on this home.
Avg. Annual Appreciation
6.05%
Original Mortgage
$301,750
Interest Rate
3%
Mortgage Type
Adjustable Rate Mortgage/ARM
Purchase Details
Listed on
Feb 19, 2013
Closed on
May 29, 2013
Sold by
Watts Micahel J
Bought by
Gaulien Andrea
Seller's Agent
Paula Maher
Capital Residential Group, LLC
Buyer's Agent
Ryan Moore
Real Broker MA, LLC
List Price
$328,900
Sold Price
$329,000
Premium/Discount to List
$100
0.03%
Home Financials for this Owner
Home Financials are based on the most recent Mortgage that was taken out on this home.
Avg. Annual Appreciation
4.66%
Original Mortgage
$319,130
Interest Rate
3.45%
Mortgage Type
New Conventional
Purchase Details
Closed on
Nov 6, 2007
Sold by
Scali Taryn M
Bought by
Watts Joan and Watts Joseph
Home Financials for this Owner
Home Financials are based on the most recent Mortgage that was taken out on this home.
Original Mortgage
$248,500
Interest Rate
6.43%
Mortgage Type
Purchase Money Mortgage
Purchase Details
Closed on
Jun 8, 2006
Sold by
Prudential Relocation
Bought by
Watts Michael and Scali Taryn M
Home Financials for this Owner
Home Financials are based on the most recent Mortgage that was taken out on this home.
Original Mortgage
$194,400
Interest Rate
6.62%
Mortgage Type
Purchase Money Mortgage
Purchase Details
Closed on
Jul 31, 2002
Sold by
Keegan Rachel C
Bought by
Cecil Jeffrey C and Cecil Julie M
Home Financials for this Owner
Home Financials are based on the most recent Mortgage that was taken out on this home.
Original Mortgage
$168,800
Interest Rate
6.64%
Mortgage Type
Purchase Money Mortgage
Purchase Details
Closed on
Dec 26, 2000
Sold by
Perry Jennifer
Bought by
Keegan Rachel C
Home Financials for this Owner
Home Financials are based on the most recent Mortgage that was taken out on this home.
Original Mortgage
$159,300
Interest Rate
7.71%
Mortgage Type
Purchase Money Mortgage
Similar Homes in the area
Create a Home Valuation Report for This Property
The Home Valuation Report is an in-depth analysis detailing your home's value as well as a comparison with similar homes in the area
Home Values in the Area
Average Home Value in this Area
Purchase History
| Date | Type | Sale Price | Title Company |
|---|---|---|---|
| Not Resolvable | $505,000 | None Available | |
| Not Resolvable | $382,500 | -- | |
| Not Resolvable | $355,000 | -- | |
| Deed | $329,000 | -- | |
| Deed | $329,000 | -- | |
| Deed | $9,000 | -- | |
| Deed | $243,000 | -- | |
| Deed | $243,000 | -- | |
| Deed | $211,000 | -- | |
| Deed | $177,000 | -- |
Source: Public Records
Mortgage History
| Date | Status | Loan Amount | Loan Type |
|---|---|---|---|
| Open | $454,500 | New Conventional | |
| Previous Owner | $363,375 | New Conventional | |
| Previous Owner | $301,750 | Adjustable Rate Mortgage/ARM | |
| Previous Owner | $319,130 | New Conventional | |
| Previous Owner | $248,500 | Purchase Money Mortgage | |
| Previous Owner | $194,400 | Purchase Money Mortgage | |
| Previous Owner | $168,800 | Purchase Money Mortgage | |
| Previous Owner | $159,300 | Purchase Money Mortgage |
Source: Public Records
Property History
| Date | Event | Price | Change | Sq Ft Price |
|---|---|---|---|---|
| 10/09/2020 10/09/20 | Sold | $505,000 | -2.7% | $721 / Sq Ft |
| 08/24/2020 08/24/20 | Pending | -- | -- | -- |
| 08/11/2020 08/11/20 | For Sale | $519,000 | 0.0% | $741 / Sq Ft |
| 04/11/2018 04/11/18 | Rented | $2,500 | +4.2% | -- |
| 04/10/2018 04/10/18 | Under Contract | -- | -- | -- |
| 04/04/2018 04/04/18 | For Rent | $2,400 | 0.0% | -- |
| 05/06/2016 05/06/16 | Sold | $382,500 | -2.9% | $546 / Sq Ft |
| 04/01/2016 04/01/16 | Pending | -- | -- | -- |
| 03/08/2016 03/08/16 | Price Changed | $394,000 | -1.3% | $563 / Sq Ft |
| 02/09/2016 02/09/16 | Price Changed | $399,000 | -2.4% | $570 / Sq Ft |
| 01/07/2016 01/07/16 | Price Changed | $409,000 | -2.4% | $584 / Sq Ft |
| 12/02/2015 12/02/15 | Price Changed | $419,000 | -2.3% | $599 / Sq Ft |
| 10/21/2015 10/21/15 | For Sale | $429,000 | +20.8% | $613 / Sq Ft |
| 01/30/2015 01/30/15 | Sold | $355,000 | 0.0% | $507 / Sq Ft |
| 11/28/2014 11/28/14 | Pending | -- | -- | -- |
| 10/29/2014 10/29/14 | Price Changed | $355,000 | -1.1% | $507 / Sq Ft |
| 10/08/2014 10/08/14 | For Sale | $359,000 | +9.1% | $513 / Sq Ft |
| 05/29/2013 05/29/13 | Sold | $329,000 | 0.0% | $470 / Sq Ft |
| 04/29/2013 04/29/13 | Pending | -- | -- | -- |
| 04/06/2013 04/06/13 | Price Changed | $328,999 | 0.0% | $470 / Sq Ft |
| 04/05/2013 04/05/13 | Price Changed | $329,000 | 0.0% | $470 / Sq Ft |
| 03/31/2013 03/31/13 | For Sale | $328,900 | 0.0% | $470 / Sq Ft |
| 03/28/2013 03/28/13 | Off Market | $329,000 | -- | -- |
| 03/24/2013 03/24/13 | Price Changed | $328,900 | 0.0% | $470 / Sq Ft |
| 03/05/2013 03/05/13 | Price Changed | $329,000 | -2.9% | $470 / Sq Ft |
| 02/19/2013 02/19/13 | For Sale | $339,000 | -- | $484 / Sq Ft |
Source: MLS Property Information Network (MLS PIN)
Tax History Compared to Growth
Tax History
| Year | Tax Paid | Tax Assessment Tax Assessment Total Assessment is a certain percentage of the fair market value that is determined by local assessors to be the total taxable value of land and additions on the property. | Land | Improvement |
|---|---|---|---|---|
| 2025 | $5,730 | $494,800 | $0 | $494,800 |
| 2024 | $5,270 | $483,500 | $0 | $483,500 |
| 2023 | $5,086 | $473,600 | $0 | $473,600 |
| 2022 | $4,954 | $455,300 | $0 | $455,300 |
| 2021 | $4,726 | $442,900 | $0 | $442,900 |
| 2020 | $4,495 | $425,700 | $0 | $425,700 |
| 2019 | $4,194 | $397,900 | $0 | $397,900 |
| 2018 | $3,971 | $378,900 | $0 | $378,900 |
| 2017 | $3,863 | $364,800 | $0 | $364,800 |
| 2016 | $3,838 | $348,900 | $0 | $348,900 |
| 2015 | $3,691 | $304,800 | $0 | $304,800 |
| 2014 | $3,423 | $272,100 | $0 | $272,100 |
Source: Public Records
Agents Affiliated with this Home
-
Seller's Agent in 2020
Shannon Rideout
Waterfront Realty Group
(508) 254-8985
20 in this area
35 Total Sales
-
D
Seller Co-Listing Agent in 2020
Dom Lange & Lindsay Coutu
Gibson Sotheby's International Realty
-
Buyer's Agent in 2020
Adriano Varano
Keller Williams Realty
(339) 222-0871
4 in this area
354 Total Sales
-
E
Seller's Agent in 2018
Everett Palozej
William Raveis R.E. & Home Services
-
Seller's Agent in 2016
Lisa Loveland
Keller Williams Realty Boston-Metro | South End
(617) 834-0137
5 in this area
68 Total Sales
-
Seller's Agent in 2015
Bryan McNeill
RE/MAX
(617) 605-9656
2 in this area
8 Total Sales
Map
Source: MLS Property Information Network (MLS PIN)
MLS Number: 71754300
APN: SBOS-000000-000006-003298-000006
Disclaimer: Certain information contained herein is derived from information provided by parties other than Homes.com. All information provided is deemed reliable, but is not guaranteed to be accurate and should be independently verified.
![]() The property listing data and information, or the Images, set forth herein were provided to MLS Property Information Network, Inc. from third party sources, including sellers, lessors and public records, and were compiled by MLS Property Information Network, Inc. The property listing data and information, and the Images, are for the personal, non-commercial use of consumers having a good faith interest in purchasing or leasing listed properties of the type displayed to them and may not be used for any purpose other than to identify prospective properties which such consumers may have a good faith interest in purchasing or leasing. MLS Property Information Network, Inc. and its subscribers disclaim any and all representations and warranties as to the accuracy of the property listing data and information, or as to the accuracy of any of the Images, set forth herein.
The property listing data and information, or the Images, set forth herein were provided to MLS Property Information Network, Inc. from third party sources, including sellers, lessors and public records, and were compiled by MLS Property Information Network, Inc. The property listing data and information, and the Images, are for the personal, non-commercial use of consumers having a good faith interest in purchasing or leasing listed properties of the type displayed to them and may not be used for any purpose other than to identify prospective properties which such consumers may have a good faith interest in purchasing or leasing. MLS Property Information Network, Inc. and its subscribers disclaim any and all representations and warranties as to the accuracy of the property listing data and information, or as to the accuracy of any of the Images, set forth herein.
Nearby Homes
- 618 E 2nd St Unit 2
- 14 I St Unit 7
- 12 I St Unit 1
- 503 E 1st St Unit 8
- 1 Schrepel Place
- 550 E 3rd St
- 191 K St Unit parking 7
- 54 I St
- 9-11 Linley Terrace Unit 2
- 202 K St Unit 4
- 571 E 3rd St
- 673 E 2nd St Unit 2
- 531-533 E 2nd St Unit 202
- 616 E 4th St Unit 404
- 616 E 4th St Unit 204
- 49 L St Unit 3
- 606 E 4th St Unit 203
- 57 L St Unit H
- 428-432 E 3rd St
- 515 E 2nd St Unit 204