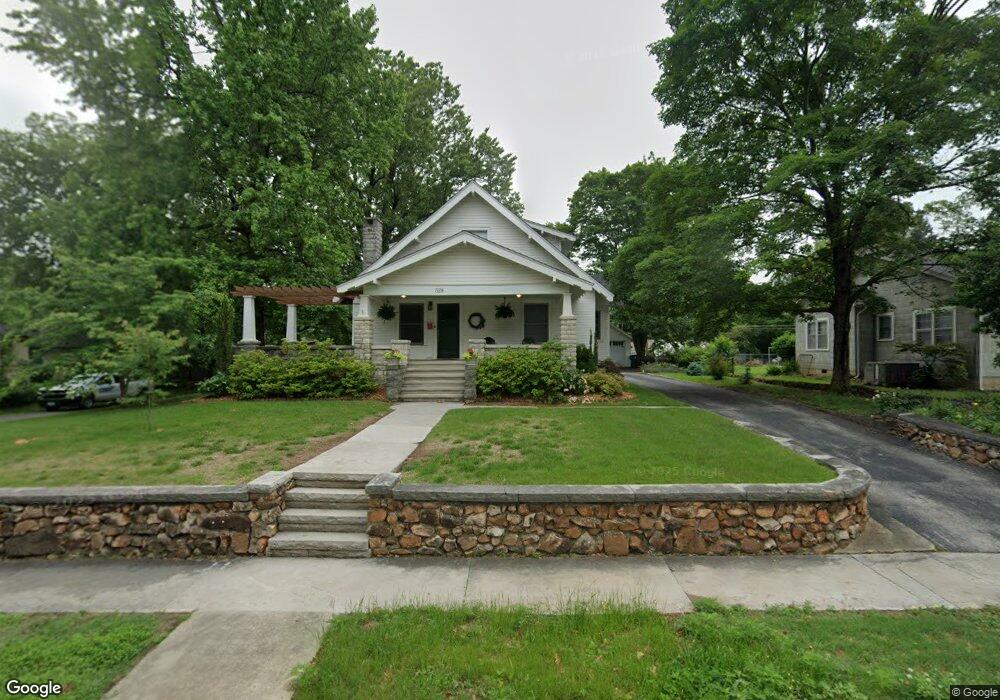
528 E Centennial Ave Carthage, MO 64836
Estimated Value: $230,859 - $249,000
3
Beds
2
Baths
1,690
Sq Ft
$142/Sq Ft
Est. Value
About This Home
This home is located at 528 E Centennial Ave, Carthage, MO 64836 and is currently estimated at $240,215, approximately $142 per square foot. 528 E Centennial Ave is a home located in Jasper County with nearby schools including Carthage High School, St. Ann's Catholic School, and Victory Academy.
Ownership History
Date
Name
Owned For
Owner Type
Purchase Details
Closed on
Nov 19, 2019
Sold by
Collier Darren B and Collier Heather J
Bought by
Theis Stephanie and Collier Sophia J
Current Estimated Value
Purchase Details
Closed on
Apr 25, 2008
Sold by
Campbell Patrick D and Campbell Hillary C
Bought by
Goff Heather Jane
Home Financials for this Owner
Home Financials are based on the most recent Mortgage that was taken out on this home.
Original Mortgage
$65,000
Interest Rate
6.11%
Mortgage Type
Purchase Money Mortgage
Purchase Details
Closed on
May 23, 2005
Sold by
Campbell Richard and Campbell Carrie
Bought by
Campbell Patrick D and Curry Hillary C
Home Financials for this Owner
Home Financials are based on the most recent Mortgage that was taken out on this home.
Original Mortgage
$75,000
Interest Rate
5.87%
Mortgage Type
Purchase Money Mortgage
Create a Home Valuation Report for This Property
The Home Valuation Report is an in-depth analysis detailing your home's value as well as a comparison with similar homes in the area
Home Values in the Area
Average Home Value in this Area
Purchase History
| Date | Buyer | Sale Price | Title Company |
|---|---|---|---|
| Theis Stephanie | -- | -- | |
| Collier Heather J | -- | -- | |
| Goff Heather Jane | -- | Abbey | |
| Campbell Patrick D | -- | -- |
Source: Public Records
Mortgage History
| Date | Status | Borrower | Loan Amount |
|---|---|---|---|
| Previous Owner | Goff Heather Jane | $65,000 | |
| Previous Owner | Campbell Patrick D | $75,000 |
Source: Public Records
Tax History
| Year | Tax Paid | Tax Assessment Tax Assessment Total Assessment is a certain percentage of the fair market value that is determined by local assessors to be the total taxable value of land and additions on the property. | Land | Improvement |
|---|---|---|---|---|
| 2025 | $1,453 | $31,870 | $2,530 | $29,340 |
| 2024 | $1,453 | $28,230 | $2,530 | $25,700 |
| 2023 | $1,453 | $28,230 | $2,530 | $25,700 |
| 2022 | $1,400 | $27,280 | $2,530 | $24,750 |
| 2021 | $1,384 | $27,280 | $2,530 | $24,750 |
| 2020 | $1,332 | $25,150 | $2,530 | $22,620 |
| 2019 | $1,334 | $25,150 | $2,530 | $22,620 |
| 2018 | $1,326 | $25,060 | $0 | $0 |
| 2017 | $1,329 | $25,060 | $0 | $0 |
| 2016 | $1,358 | $25,680 | $0 | $0 |
Source: Public Records
Map
Nearby Homes
- 702 E Centennial Ave
- 1513 S Main St
- 911 Euclid Blvd
- 303 W Centennial Ave
- 537 E Macon St
- 1910 Wynwood Dr
- 1830 S Maple St
- 1142 S River St
- 1131 Belle Air Place
- 414 Pine St
- 1144 S Main St
- 1160 S Maple St
- 509 W Highland Ave
- 1617 Glenwood Place
- 1647 Glenwood Place
- 1112 S Garrison Ave
- 1615 Forest St
- 1135 Lyon St
- 1131 Lyon St
- 112 E 11th St
- 522 E Centennial Ave
- 600 E Centennial Ave
- 516 E Centennial Ave
- 529 Euclid Blvd
- 610 E Centennial Ave
- 523 Euclid Blvd
- 605 Euclid Blvd
- 515 Euclid Blvd
- 527 E Centennial Ave
- 519 E Centennial Ave
- 509 Euclid Blvd
- 502 E Centennial Ave
- 1610 Clinton St
- 515 E Centennial Ave
- 615 Euclid Blvd
- 618 E Centennial Ave
- 505 Euclid Blvd
- 611 E Centennial Ave
- 509 E Centennial Ave
- 509 E Centennial Ave Unit 1
Your Personal Tour Guide
Ask me questions while you tour the home.