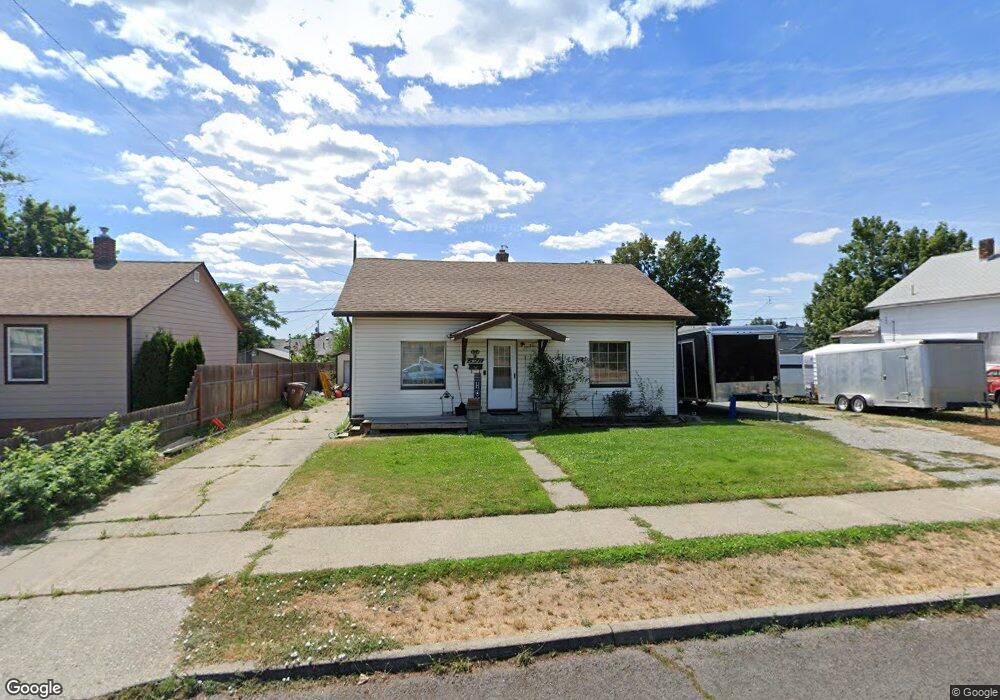
528 E Kiernan Ave Spokane, WA 99207
Nevada Lidgerwood NeighborhoodEstimated Value: $241,000 - $316,000
2
Beds
1
Bath
950
Sq Ft
$292/Sq Ft
Est. Value
About This Home
This home is located at 528 E Kiernan Ave, Spokane, WA 99207 and is currently estimated at $277,230, approximately $291 per square foot. 528 E Kiernan Ave is a home located in Spokane County with nearby schools including Longfellow Elementary School, Garry Middle School, and Rogers High School.
Ownership History
Date
Name
Owned For
Owner Type
Purchase Details
Closed on
Oct 11, 2021
Sold by
Varner Frank E
Bought by
Varner Frank and Jacobsen Cindi
Current Estimated Value
Home Financials for this Owner
Home Financials are based on the most recent Mortgage that was taken out on this home.
Original Mortgage
$167,638
Outstanding Balance
$152,870
Interest Rate
2.8%
Mortgage Type
FHA
Estimated Equity
$124,360
Purchase Details
Closed on
Jan 17, 2003
Sold by
Varner Tracy A and Popham Tracy A
Bought by
Varner Frank E and Varner Tracy A
Home Financials for this Owner
Home Financials are based on the most recent Mortgage that was taken out on this home.
Original Mortgage
$49,240
Interest Rate
5.97%
Mortgage Type
FHA
Purchase Details
Closed on
Oct 24, 1996
Sold by
Runyan Marian H
Bought by
Popham Tracy A
Home Financials for this Owner
Home Financials are based on the most recent Mortgage that was taken out on this home.
Original Mortgage
$54,294
Interest Rate
8.3%
Mortgage Type
FHA
Create a Home Valuation Report for This Property
The Home Valuation Report is an in-depth analysis detailing your home's value as well as a comparison with similar homes in the area
Home Values in the Area
Average Home Value in this Area
Purchase History
| Date | Buyer | Sale Price | Title Company |
|---|---|---|---|
| Varner Frank | $18,500 | Wfg National Title Company | |
| Varner Frank | -- | Wfg National Title Company | |
| Varner Frank E | -- | Spokane County Title Co | |
| Popham Tracy A | $54,000 | Spokane County Title Co |
Source: Public Records
Mortgage History
| Date | Status | Borrower | Loan Amount |
|---|---|---|---|
| Open | Varner Frank | $167,638 | |
| Closed | Varner Frank E | $49,240 | |
| Closed | Popham Tracy A | $54,294 |
Source: Public Records
Tax History
| Year | Tax Paid | Tax Assessment Tax Assessment Total Assessment is a certain percentage of the fair market value that is determined by local assessors to be the total taxable value of land and additions on the property. | Land | Improvement |
|---|---|---|---|---|
| 2025 | $2,523 | $255,400 | $75,000 | $180,400 |
| 2024 | $2,523 | $253,800 | $70,000 | $183,800 |
| 2023 | $2,438 | $248,800 | $65,000 | $183,800 |
| 2022 | $2,056 | $248,800 | $65,000 | $183,800 |
| 2021 | $1,796 | $150,500 | $35,000 | $115,500 |
| 2020 | $1,644 | $132,700 | $35,000 | $97,700 |
| 2019 | $1,383 | $115,400 | $23,500 | $91,900 |
| 2018 | $1,480 | $106,100 | $20,000 | $86,100 |
| 2017 | $1,359 | $99,200 | $20,000 | $79,200 |
| 2016 | $1,365 | $97,500 | $20,000 | $77,500 |
| 2015 | $1,329 | $92,900 | $20,000 | $72,900 |
| 2014 | -- | $92,100 | $20,000 | $72,100 |
| 2013 | -- | $0 | $0 | $0 |
Source: Public Records
Map
Nearby Homes
- 517 E Courtland Ave
- 427 E Glass Ave
- 429 E Gordon Ave
- 712 E Kiernan Ave
- 603 E Liberty Ave
- 813 E Courtland Ave
- 824 E Gordon Ave
- 818 E Courtland Ave
- 511 E Euclid Ave
- 923 E Courtland Ave
- 117 E Glass Ave
- 917 E Bridgeport Ave
- 504 E Lacrosse Ave
- 807 E Euclid Ave
- 1027 E Courtland Ave
- 1103 E Glass Ave
- 1028 E Courtland Ave
- 624 E Rockwell Ave
- 1012 E Garland Ave
- 726 E Rockwell Ave
- 532 E Kiernan Ave
- 518 E Kiernan Ave
- 538 E Kiernan Ave
- 527 E Gordon Ave
- 533 E Gordon Ave
- 523 E Gordon Ave
- 514 E Kiernan Ave
- 544 E Kiernan Ave
- 517 E Gordon Ave
- 537 E Gordon Ave
- 513 E Gordon Ave
- 543 E Gordon Ave
- 517 E Kiernan Ave
- 508 E Kiernan Ave
- 548 E Kiernan Ave
- 511 E Kiernan Ave
- 507 E Gordon Ave
- 547 E Gordon Ave
- 504 E Kiernan Ave
- 507 E Kiernan Ave
Your Personal Tour Guide
Ask me questions while you tour the home.