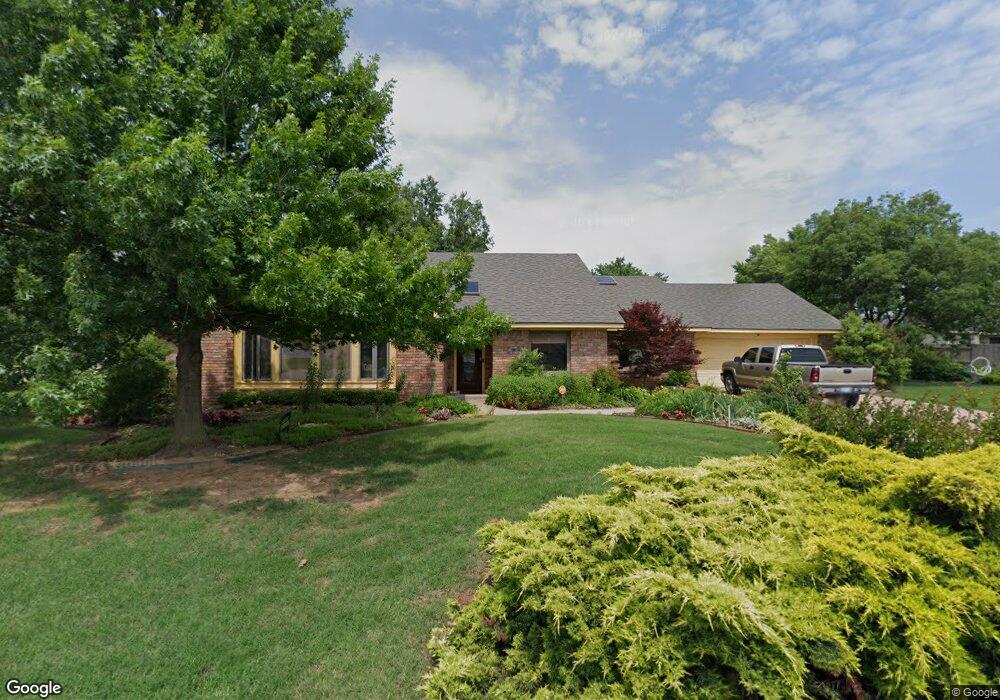
528 Flanders Dr Chickasha, OK 73018
Estimated Value: $218,000 - $255,000
3
Beds
2
Baths
2,115
Sq Ft
$115/Sq Ft
Est. Value
About This Home
This home is located at 528 Flanders Dr, Chickasha, OK 73018 and is currently estimated at $242,475, approximately $114 per square foot. 528 Flanders Dr is a home located in Grady County with nearby schools including Grand Avenue Elementary School, Chickasha Middle School, and Lincoln Elementary School.
Ownership History
Date
Name
Owned For
Owner Type
Purchase Details
Closed on
Nov 20, 2023
Sold by
Ortiz Brenda V and Ortiz Edward
Bought by
Durham Gereldene
Current Estimated Value
Purchase Details
Closed on
May 23, 2013
Sold by
Durham Gereldene
Bought by
Graves Brenda
Home Financials for this Owner
Home Financials are based on the most recent Mortgage that was taken out on this home.
Original Mortgage
$81,000
Interest Rate
3.45%
Mortgage Type
New Conventional
Purchase Details
Closed on
Mar 16, 2011
Sold by
Graves Brenda V and Graves Brenda Vanessa
Bought by
Durham Gereldene
Purchase Details
Closed on
May 6, 2009
Sold by
Durham Gereldene
Bought by
Graves Brenda
Purchase Details
Closed on
Jan 22, 2009
Sold by
Durham Gereldene
Bought by
Durham Gereldene and Graves Brenda Vanessa
Purchase Details
Closed on
May 2, 2001
Sold by
Stanley Smith
Bought by
Gereldene Durham
Create a Home Valuation Report for This Property
The Home Valuation Report is an in-depth analysis detailing your home's value as well as a comparison with similar homes in the area
Home Values in the Area
Average Home Value in this Area
Purchase History
| Date | Buyer | Sale Price | Title Company |
|---|---|---|---|
| Durham Gereldene | -- | None Listed On Document | |
| Graves Brenda | $101,500 | None Available | |
| Durham Gereldene | -- | None Available | |
| Graves Brenda | -- | None Available | |
| Durham Gereldene | -- | None Available | |
| Gereldene Durham | $135,000 | -- |
Source: Public Records
Mortgage History
| Date | Status | Borrower | Loan Amount |
|---|---|---|---|
| Previous Owner | Graves Brenda | $81,000 |
Source: Public Records
Tax History Compared to Growth
Tax History
| Year | Tax Paid | Tax Assessment Tax Assessment Total Assessment is a certain percentage of the fair market value that is determined by local assessors to be the total taxable value of land and additions on the property. | Land | Improvement |
|---|---|---|---|---|
| 2024 | $1,558 | $16,367 | $2,677 | $13,690 |
| 2023 | $1,558 | $15,890 | $3,050 | $12,840 |
| 2022 | $1,549 | $15,894 | $3,129 | $12,765 |
| 2021 | $1,463 | $15,554 | $2,145 | $13,409 |
| 2020 | $1,533 | $15,889 | $2,145 | $13,744 |
| 2019 | $1,538 | $16,224 | $2,145 | $14,079 |
| 2018 | $1,623 | $16,769 | $2,145 | $14,624 |
| 2017 | $1,612 | $16,569 | $2,145 | $14,424 |
| 2016 | $1,587 | $16,202 | $2,015 | $14,187 |
| 2015 | $1,495 | $15,731 | $1,722 | $14,009 |
| 2014 | $1,495 | $15,272 | $1,579 | $13,693 |
Source: Public Records
Map
Nearby Homes
- 511 Flanders Dr
- 3520 Redbud Dr
- 3516 Redbud Dr
- 127 Rosewood Dr
- 3023 Westbrook St
- 0 Pondridge Rd Unit 1092947
- 120 Sheridan Place
- 3224 Pondridge Rd
- 104 Caulder Dr
- 3312 S 23rd St
- 3310 S 23rd St
- 3308 S 23rd St
- 3306 S 23rd St
- 3304 S 23rd St
- 2220 Dillards Dr
- 2016 Dillards Dr
- 205 Meadowdale Dr
- 212 Meadowdale Dr
- 207 Saint James Place
- Ferris Plan at Sleepy Hollow
- 206 Brookpark Ln
- 203 Pleasant Ln
- 201 Pleasant Ln
- 105 Brookpark Ln
- 205 Pleasant Ln
- 602 Flanders Dr
- 208 Brookpark Ln
- 515 Flanders Dr
- 601 Flanders Dr
- 207 Pleasant Ln
- 513 Flanders Dr
- 604 Flanders Dr
- 210 Brookpark Ln
- 603 Flanders Dr
- 125 Bowerwood Dr
- 209 Pleasant Ln
- 107 Brookpark Ln
- 204 Pleasant Ln
- 606 Flanders Dr
- 206 Pleasant Ln