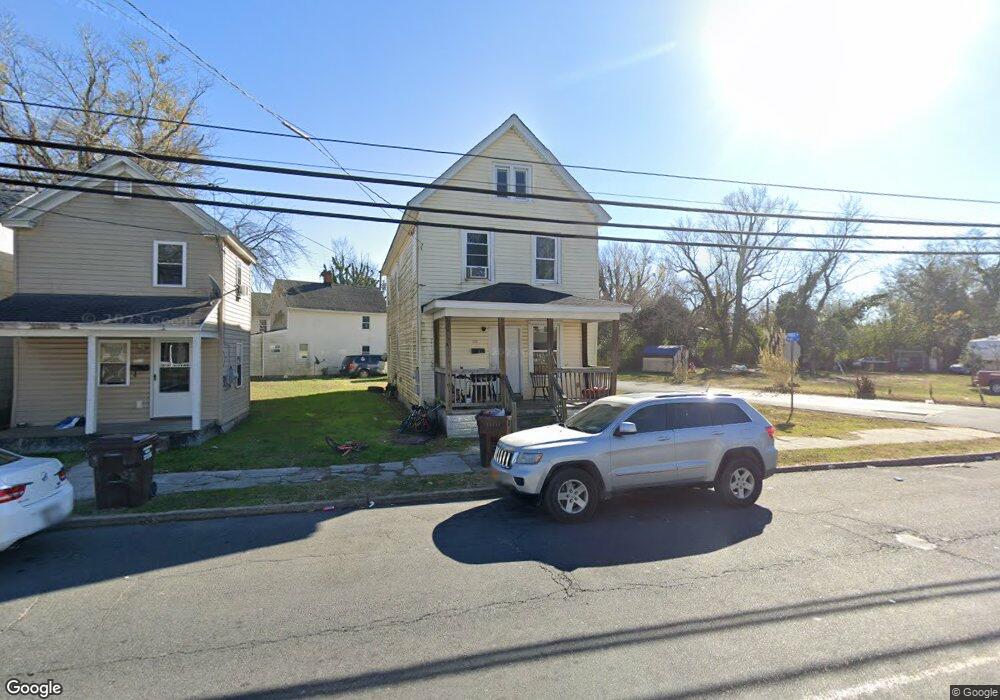
528 High St Cambridge, MD 21613
Estimated Value: $82,010 - $163,000
3
Beds
1
Bath
1,452
Sq Ft
$85/Sq Ft
Est. Value
About This Home
This home is located at 528 High St, Cambridge, MD 21613 and is currently estimated at $123,503, approximately $85 per square foot. 528 High St is a home located in Dorchester County with nearby schools including Maple Elementary School, Mace's Lane Middle School, and Cambridge-South Dorchester High School.
Ownership History
Date
Name
Owned For
Owner Type
Purchase Details
Closed on
Dec 15, 2016
Sold by
Spears Michael J
Bought by
Jwb Properties Llc
Current Estimated Value
Purchase Details
Closed on
Apr 19, 2011
Sold by
Citifinancial Inc
Bought by
Money Line Mortgage Llc
Purchase Details
Closed on
Feb 10, 2011
Sold by
Citifinancial Inc
Bought by
Money Line Mortgage Llc
Purchase Details
Closed on
Dec 2, 2010
Sold by
Jews Jean Marie
Bought by
Citifinancial Inc
Purchase Details
Closed on
Jun 12, 1995
Sold by
Jews Russell Wesley
Bought by
Jews Jean Marie
Create a Home Valuation Report for This Property
The Home Valuation Report is an in-depth analysis detailing your home's value as well as a comparison with similar homes in the area
Home Values in the Area
Average Home Value in this Area
Purchase History
| Date | Buyer | Sale Price | Title Company |
|---|---|---|---|
| Jwb Properties Llc | $8,300 | None Available | |
| Money Line Mortgage Llc | -- | -- | |
| Money Line Mortgage Llc | -- | -- | |
| Citifinancial Inc | $25,139 | -- | |
| Jews Jean Marie | -- | -- |
Source: Public Records
Tax History
| Year | Tax Paid | Tax Assessment Tax Assessment Total Assessment is a certain percentage of the fair market value that is determined by local assessors to be the total taxable value of land and additions on the property. | Land | Improvement |
|---|---|---|---|---|
| 2025 | $920 | $49,000 | $6,000 | $43,000 |
| 2024 | $760 | $45,067 | $0 | $0 |
| 2023 | $760 | $41,133 | $0 | $0 |
| 2022 | $688 | $37,200 | $6,000 | $31,200 |
| 2021 | $536 | $32,800 | $0 | $0 |
| 2020 | $536 | $28,400 | $0 | $0 |
| 2019 | $458 | $24,000 | $6,000 | $18,000 |
| 2018 | $446 | $24,000 | $6,000 | $18,000 |
| 2017 | $446 | $24,000 | $0 | $0 |
| 2016 | -- | $34,400 | $0 | $0 |
| 2015 | $737 | $34,400 | $0 | $0 |
| 2014 | $737 | $34,400 | $0 | $0 |
Source: Public Records
Map
Nearby Homes
Your Personal Tour Guide
Ask me questions while you tour the home.