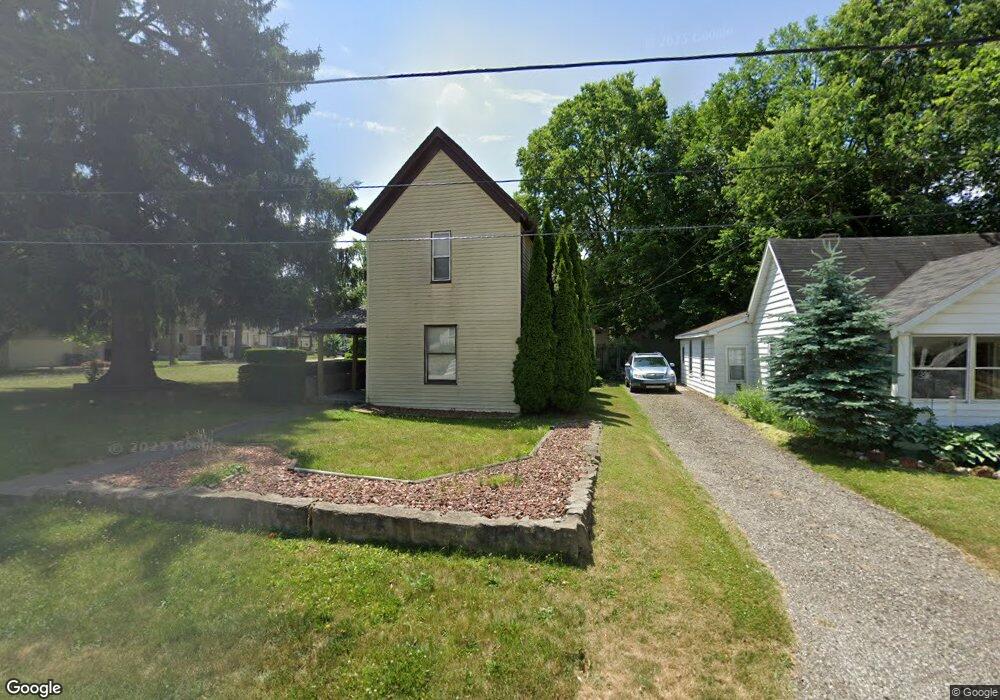
528 Hubbard St NE Grand Rapids, MI 49525
Northview NeighborhoodEstimated Value: $259,000 - $327,000
3
Beds
1
Bath
1,363
Sq Ft
$213/Sq Ft
Est. Value
About This Home
This home is located at 528 Hubbard St NE, Grand Rapids, MI 49525 and is currently estimated at $290,243, approximately $212 per square foot. 528 Hubbard St NE is a home located in Kent County with nearby schools including North Park Montessori Academy, Riverside Middle School, and Union High School.
Ownership History
Date
Name
Owned For
Owner Type
Purchase Details
Closed on
Mar 25, 2021
Sold by
Pelton Andrew R
Bought by
Pelton Andrew R and Pelton Edward R
Current Estimated Value
Purchase Details
Closed on
Nov 7, 2003
Sold by
Loveless William S and Loveless Jennifer A
Bought by
Pelton Andrew R
Home Financials for this Owner
Home Financials are based on the most recent Mortgage that was taken out on this home.
Original Mortgage
$90,800
Interest Rate
6.01%
Mortgage Type
Purchase Money Mortgage
Purchase Details
Closed on
Dec 28, 1998
Sold by
Lvls Wltrnk
Bought by
Lvls Lvls W and Lvls J
Purchase Details
Closed on
Apr 24, 1997
Sold by
Lvlss Wht T
Bought by
Lvlss and Lvlss Wltrnk
Purchase Details
Closed on
Aug 12, 1994
Sold by
Gillhespy Gillhespy K K and Gillhespy White T
Bought by
Pelton Andrew R
Purchase Details
Closed on
Jul 20, 1984
Purchase Details
Closed on
May 6, 1981
Create a Home Valuation Report for This Property
The Home Valuation Report is an in-depth analysis detailing your home's value as well as a comparison with similar homes in the area
Home Values in the Area
Average Home Value in this Area
Purchase History
| Date | Buyer | Sale Price | Title Company |
|---|---|---|---|
| Pelton Andrew R | -- | None Available | |
| Pelton Edward R | -- | None Listed On Document | |
| Pelton Andrew R | $113,500 | Chicago Title | |
| Lvls Lvls W | -- | -- | |
| Lvlss | $72,000 | -- | |
| Pelton Andrew R | $65,000 | -- | |
| -- | $27,000 | -- | |
| -- | $27,000 | -- |
Source: Public Records
Mortgage History
| Date | Status | Borrower | Loan Amount |
|---|---|---|---|
| Previous Owner | Pelton Andrew R | $90,800 | |
| Closed | Pelton Andrew R | $11,300 |
Source: Public Records
Tax History Compared to Growth
Tax History
| Year | Tax Paid | Tax Assessment Tax Assessment Total Assessment is a certain percentage of the fair market value that is determined by local assessors to be the total taxable value of land and additions on the property. | Land | Improvement |
|---|---|---|---|---|
| 2025 | $1,455 | $115,100 | $0 | $0 |
| 2024 | $1,455 | $103,100 | $0 | $0 |
| 2023 | $1,476 | $87,900 | $0 | $0 |
| 2022 | $1,401 | $83,500 | $0 | $0 |
| 2021 | $1,370 | $69,900 | $0 | $0 |
| 2020 | $1,310 | $64,500 | $0 | $0 |
| 2019 | $1,372 | $59,100 | $0 | $0 |
| 2018 | $1,325 | $49,300 | $0 | $0 |
| 2017 | $1,290 | $42,100 | $0 | $0 |
| 2016 | $1,305 | $40,100 | $0 | $0 |
| 2015 | $1,214 | $40,100 | $0 | $0 |
| 2013 | -- | $35,700 | $0 | $0 |
Source: Public Records
Map
Nearby Homes
- 3274 Briggs Blvd NE
- 3261 Essex St NE
- 3151 Kendalwood Ct NE
- 536 Wright St NE
- 3134 Cheney Ave NE
- 753 Revere St NE
- 3785 Willow Dr NE
- 1030 4 Mile Rd NE
- 625 Grand Woods Ct NE
- 3776 Eastern Ave NE
- 2765 Oakwood Ave NE
- 3030 Plainfield Ave NE
- 2723 Oakwood Ave NE
- 2630 Oakwood Ave NE
- 3836 Standish Ave NE
- 308 Sligh Blvd NE
- 3551 Fuller Ave NE
- 2700 Plainfield Ave NE
- 1050 3 Mile Rd NE
- 3661 Willow Dr NE
- 522 Hubbard St NE
- 3271 Paris Ave NE
- 600 Hubbard St NE
- 3280 College Ave NE
- 3267 Paris Ave NE
- 604 Hubbard St NE
- 3276 College Ave NE
- 3272 Paris Ave NE
- 3272 College Ave NE
- 533 Hubbard St NE
- 3263 Paris Ave NE
- 3266 Paris Ave NE
- 519 Hubbard St NE
- 608 Hubbard St NE
- 601 Hubbard St NE
- 3266 College Ave NE
- 3262 Paris Ave NE
- 501 Hubbard St NE
- 607 Hubbard St NE
- 3317 Paris Ave NE