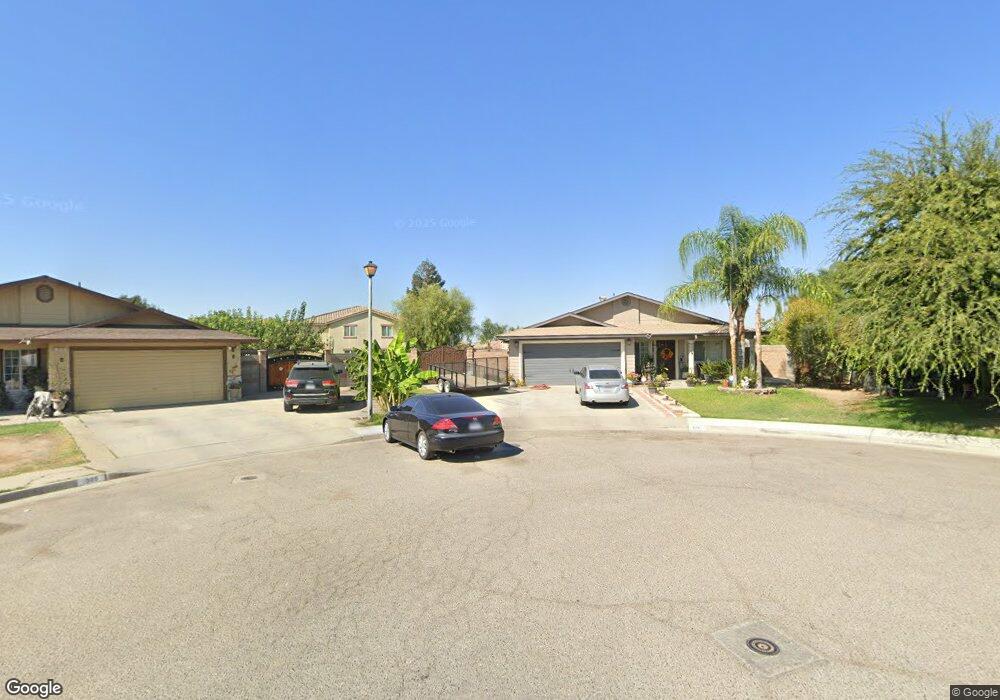
528 Kimo Ct Mc Farland, CA 93250
Estimated Value: $300,000 - $334,000
4
Beds
2
Baths
1,232
Sq Ft
$255/Sq Ft
Est. Value
About This Home
This home is located at 528 Kimo Ct, Mc Farland, CA 93250 and is currently estimated at $313,874, approximately $254 per square foot. 528 Kimo Ct is a home located in Kern County with nearby schools including McFarland High School.
Ownership History
Date
Name
Owned For
Owner Type
Purchase Details
Closed on
Oct 21, 2019
Sold by
Gonzalez Ivan B
Bought by
Gonzalez Lizbeth I
Current Estimated Value
Home Financials for this Owner
Home Financials are based on the most recent Mortgage that was taken out on this home.
Original Mortgage
$67,000
Outstanding Balance
$58,874
Interest Rate
3.65%
Mortgage Type
New Conventional
Estimated Equity
$255,000
Purchase Details
Closed on
Dec 12, 1994
Sold by
Self Help Enterprises
Bought by
Perez Pedro and Perez Elizabeth
Home Financials for this Owner
Home Financials are based on the most recent Mortgage that was taken out on this home.
Original Mortgage
$58,900
Interest Rate
9.1%
Create a Home Valuation Report for This Property
The Home Valuation Report is an in-depth analysis detailing your home's value as well as a comparison with similar homes in the area
Home Values in the Area
Average Home Value in this Area
Purchase History
We collect this data history from publicly available records. To have your information removed, we recommend requesting removal directly through your county’s website.
| Date | Buyer | Sale Price | Title Company |
|---|---|---|---|
| Gonzalez Lizbeth I | -- | Chicago Title Company | |
| Perez Pedro | $18,000 | Chicago Title Company |
Source: Public Records
Mortgage History
We collect this data history from publicly available records. To have your information removed, we recommend requesting removal directly through your county’s website.
| Date | Status | Borrower | Loan Amount |
|---|---|---|---|
| Open | Gonzalez Lizbeth I | $67,000 | |
| Closed | Perez Pedro | $58,900 |
Source: Public Records
Tax History
| Year | Tax Paid | Tax Assessment Tax Assessment Total Assessment is a certain percentage of the fair market value that is determined by local assessors to be the total taxable value of land and additions on the property. | Land | Improvement |
|---|---|---|---|---|
| 2025 | $1,893 | $157,423 | $37,332 | $120,091 |
| 2024 | $1,860 | $154,337 | $36,600 | $117,737 |
| 2023 | $1,860 | $151,312 | $35,883 | $115,429 |
| 2022 | $1,815 | $148,346 | $35,180 | $113,166 |
| 2021 | $1,739 | $145,439 | $34,491 | $110,948 |
| 2020 | $2,117 | $181,000 | $40,000 | $141,000 |
| 2019 | $1,149 | $104,177 | $27,631 | $76,546 |
| 2018 | $1,134 | $100,134 | $26,559 | $73,575 |
| 2017 | $1,104 | $98,172 | $26,039 | $72,133 |
| 2016 | $1,089 | $96,248 | $25,529 | $70,719 |
| 2015 | $1,068 | $94,803 | $25,146 | $69,657 |
| 2014 | $1,022 | $92,947 | $24,654 | $68,293 |
Source: Public Records
Map
Nearby Homes
- 830 Davis Ave
- 761 3rd St
- 908 Costa Alyssa Dr
- 0 W Sherwood Ave Unit 241649
- 0 W Sherwood Ave Unit 202506495
- 314 8th St
- Mcfarland Unit California 93250
- 749 Browning Rd
- 105 E Kern Ave
- 216 Browning Rd
- 31737 Elmo Hwy
- 13271 Garzoli Ave
- 737 Concord Ct
- 729 Yahut St
- 700 Taylor Ave
- 583 Taylor Ave
- 1085 Mast Ave
- 12606 Stradley Ave
- 775 Mast Ave
- 11697 Melcher Rd
Your Personal Tour Guide
Ask me questions while you tour the home.