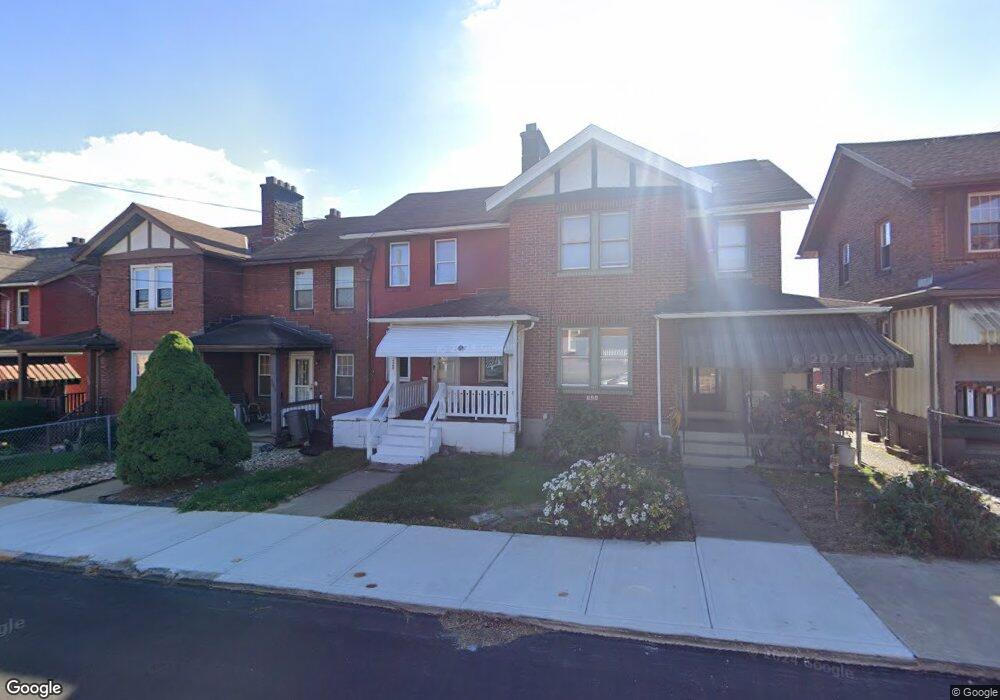
528 Maple St East Pittsburgh, PA 15112
Estimated Value: $48,000 - $56,000
2
Beds
1
Bath
934
Sq Ft
$56/Sq Ft
Est. Value
About This Home
This home is located at 528 Maple St, East Pittsburgh, PA 15112 and is currently estimated at $51,886, approximately $55 per square foot. 528 Maple St is a home located in Allegheny County with nearby schools including Woodland Hills Senior High School, Braddock Hills High School, and Propel Cs-East.
Ownership History
Date
Name
Owned For
Owner Type
Purchase Details
Closed on
Jan 17, 2023
Sold by
Peachtree Associates L L C
Bought by
Thompson I Properties L L C
Current Estimated Value
Purchase Details
Closed on
Nov 9, 2022
Sold by
Peachtree Associates Llc
Bought by
Thompson 1 Properties Llc
Purchase Details
Closed on
May 19, 2009
Sold by
Fannie Mae
Bought by
Peach Tree Assoc L L C
Purchase Details
Closed on
Feb 2, 2009
Sold by
Davis Antoine G
Bought by
Federal National Mortgage Association
Purchase Details
Closed on
Dec 8, 2004
Sold by
Gregor Claire M
Bought by
Davis Antoine G and Davis Dashoka T
Home Financials for this Owner
Home Financials are based on the most recent Mortgage that was taken out on this home.
Original Mortgage
$24,000
Interest Rate
5.75%
Mortgage Type
New Conventional
Create a Home Valuation Report for This Property
The Home Valuation Report is an in-depth analysis detailing your home's value as well as a comparison with similar homes in the area
Home Values in the Area
Average Home Value in this Area
Purchase History
| Date | Buyer | Sale Price | Title Company |
|---|---|---|---|
| Thompson I Properties L L C | $70,875 | -- | |
| Thompson 1 Properties Llc | $1,240,312 | -- | |
| Thompson 1 Properties Llc | $1,240,312 | -- | |
| Peach Tree Assoc L L C | $11,000 | -- | |
| Federal National Mortgage Association | $1,932 | -- | |
| Davis Antoine G | $24,000 | None Available |
Source: Public Records
Mortgage History
| Date | Status | Borrower | Loan Amount |
|---|---|---|---|
| Previous Owner | Davis Antoine G | $24,000 |
Source: Public Records
Tax History Compared to Growth
Tax History
| Year | Tax Paid | Tax Assessment Tax Assessment Total Assessment is a certain percentage of the fair market value that is determined by local assessors to be the total taxable value of land and additions on the property. | Land | Improvement |
|---|---|---|---|---|
| 2025 | $536 | $12,000 | $1,600 | $10,400 |
| 2024 | $536 | $12,000 | $1,600 | $10,400 |
| 2023 | $542 | $12,000 | $1,600 | $10,400 |
| 2022 | $542 | $12,000 | $1,600 | $10,400 |
| 2021 | $57 | $12,000 | $1,600 | $10,400 |
| 2020 | $531 | $12,000 | $1,600 | $10,400 |
| 2019 | $522 | $12,000 | $1,600 | $10,400 |
| 2018 | $57 | $12,000 | $1,600 | $10,400 |
| 2017 | $522 | $12,000 | $1,600 | $10,400 |
| 2016 | $57 | $12,000 | $1,600 | $10,400 |
| 2015 | $57 | $12,000 | $1,600 | $10,400 |
| 2014 | $489 | $12,000 | $1,600 | $10,400 |
Source: Public Records
Map
Nearby Homes