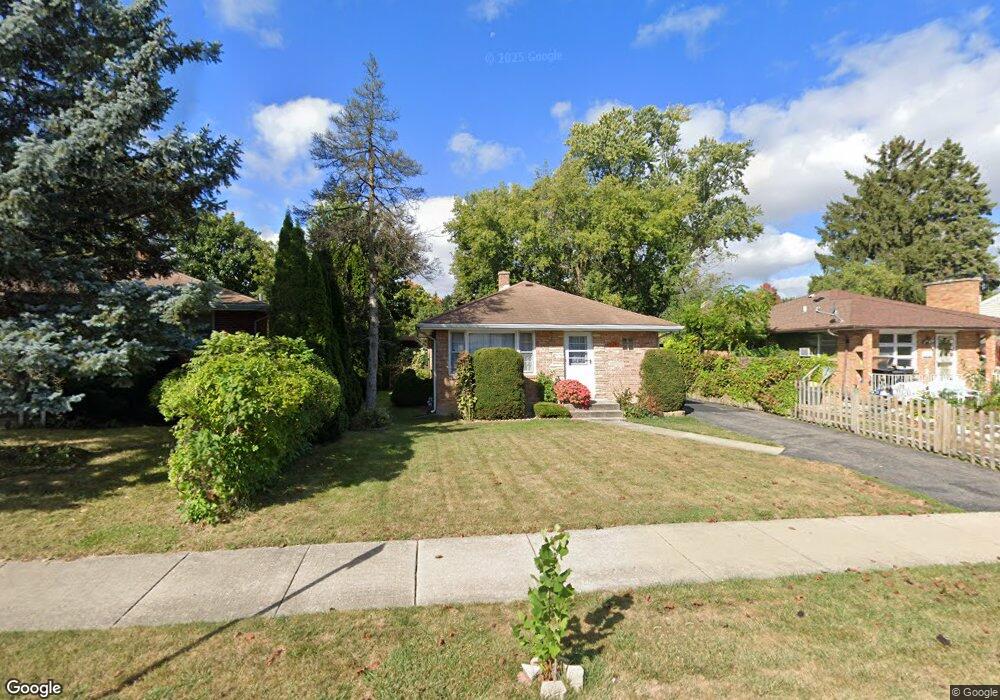
528 N Lewis Ave Waukegan, IL 60085
West Waukegan NeighborhoodEstimated Value: $203,754 - $214,000
2
Beds
1
Bath
864
Sq Ft
$242/Sq Ft
Est. Value
About This Home
This home is located at 528 N Lewis Ave, Waukegan, IL 60085 and is currently estimated at $208,689, approximately $241 per square foot. 528 N Lewis Ave is a home located in Lake County with nearby schools including Whittier Elementary School, Robert E. Abbott Middle School, and Waukegan High School.
Ownership History
Date
Name
Owned For
Owner Type
Purchase Details
Closed on
May 5, 2001
Sold by
Arias Ignacio and Arias Laura
Bought by
Arias Ignacio and Arias Laura
Current Estimated Value
Home Financials for this Owner
Home Financials are based on the most recent Mortgage that was taken out on this home.
Original Mortgage
$79,050
Interest Rate
7.2%
Purchase Details
Closed on
Jun 6, 1997
Sold by
Skoff Thomas
Bought by
Arias Ignacio and Arias Laura
Home Financials for this Owner
Home Financials are based on the most recent Mortgage that was taken out on this home.
Original Mortgage
$80,726
Interest Rate
8%
Mortgage Type
FHA
Purchase Details
Closed on
Sep 29, 1994
Sold by
Thomas Kathleen P and Greiner Rose M
Bought by
Skoff Thomas
Home Financials for this Owner
Home Financials are based on the most recent Mortgage that was taken out on this home.
Original Mortgage
$69,000
Interest Rate
8.6%
Create a Home Valuation Report for This Property
The Home Valuation Report is an in-depth analysis detailing your home's value as well as a comparison with similar homes in the area
Home Values in the Area
Average Home Value in this Area
Purchase History
| Date | Buyer | Sale Price | Title Company |
|---|---|---|---|
| Arias Ignacio | -- | -- | |
| Arias Ignacio | $54,000 | -- | |
| Skoff Thomas | $74,000 | -- |
Source: Public Records
Mortgage History
| Date | Status | Borrower | Loan Amount |
|---|---|---|---|
| Closed | Arias Ignacio | $79,050 | |
| Closed | Arias Ignacio | $80,726 | |
| Previous Owner | Skoff Thomas | $69,000 |
Source: Public Records
Tax History Compared to Growth
Tax History
| Year | Tax Paid | Tax Assessment Tax Assessment Total Assessment is a certain percentage of the fair market value that is determined by local assessors to be the total taxable value of land and additions on the property. | Land | Improvement |
|---|---|---|---|---|
| 2024 | $3,429 | $49,549 | $10,244 | $39,305 |
| 2023 | $3,275 | $44,362 | $9,172 | $35,190 |
| 2022 | $3,275 | $39,497 | $7,414 | $32,083 |
| 2021 | $3,166 | $36,364 | $6,859 | $29,505 |
| 2020 | $3,160 | $33,877 | $6,390 | $27,487 |
| 2019 | $3,128 | $31,042 | $5,855 | $25,187 |
| 2018 | $2,764 | $27,758 | $7,532 | $20,226 |
| 2017 | $2,640 | $24,558 | $6,664 | $17,894 |
| 2016 | $2,371 | $21,340 | $5,791 | $15,549 |
| 2015 | $2,213 | $19,100 | $5,183 | $13,917 |
| 2014 | $2,123 | $18,085 | $5,463 | $12,622 |
| 2012 | $2,851 | $19,592 | $5,918 | $13,674 |
Source: Public Records
Map
Nearby Homes
- 2115 Lydia St
- 1213 Grand Ave
- 615 Tiffany Dr
- 0 Brookside Ave
- 1005 N Lewis Ave
- 824 N Butrick St
- 968 Judge Ave
- 1023 N Elmwood Ave
- 1038 Indiana Ave
- 1416 Hamilton Ct
- 1109 Massena Ave
- 1000 Pine St
- 1117 Judge Ave
- 49 S Lewis Ave
- 917 N Linden Ave
- 1521 Catalpa Ave
- 1504 W Glen Flora Ave
- 24 Washington Terrace
- 23 N Jackson St
- 511 Chestnut St
- 524 N Lewis Ave
- 532 N Lewis Ave
- 536 N Lewis Ave
- 1900 Lydia St
- 527 Westmoreland Ave
- 527 Westmoreland Ave
- 531 Westmoreland Ave
- 602 N Lewis Ave
- 535 Westmoreland Ave
- 1822 Lydia St
- 603 Westmoreland Ave
- 606 N Lewis Ave
- 533 N Lewis Ave
- 1818 Lydia St
- 537 N Lewis Ave
- 607 Westmoreland Ave
- 1901 Lydia St
- 610 N Lewis Ave
- 603 N Lewis Ave
- 1814 Lydia St