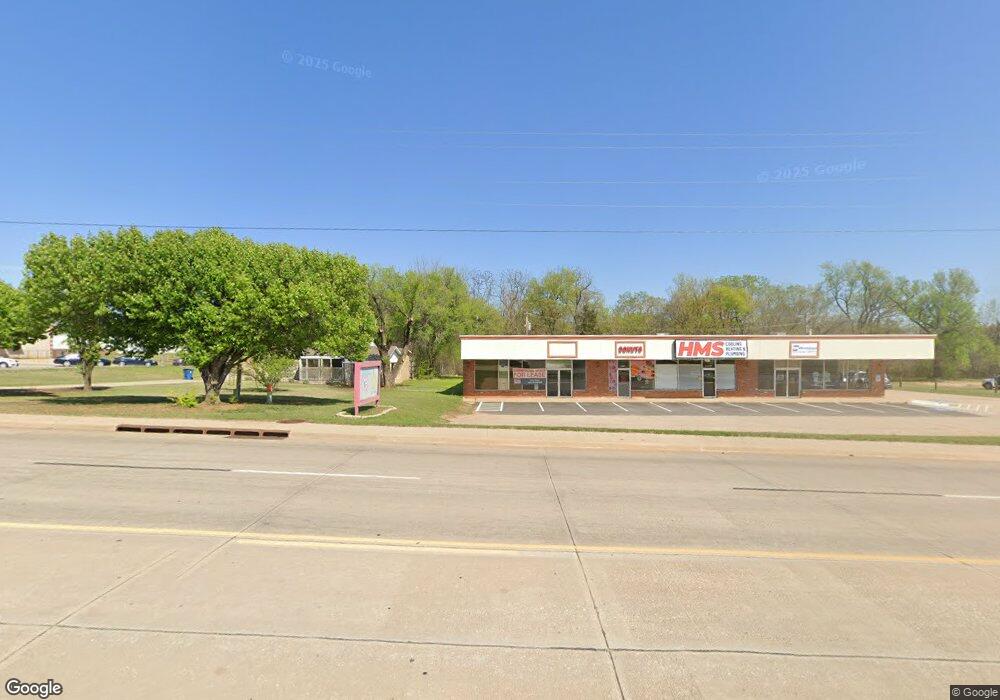
528 N Main St Newcastle, OK 73065
Estimated Value: $175,000 - $211,000
3
Beds
1
Bath
1,494
Sq Ft
$133/Sq Ft
Est. Value
About This Home
This home is located at 528 N Main St, Newcastle, OK 73065 and is currently estimated at $198,186, approximately $132 per square foot. 528 N Main St is a home located in McClain County with nearby schools including Newcastle Elementary School, Newcastle Middle School, and Newcastle High School.
Ownership History
Date
Name
Owned For
Owner Type
Purchase Details
Closed on
Feb 2, 2024
Sold by
Grant Justin Thomas and Grant Angela Denise
Bought by
Series Ten Of Jtg Llc
Current Estimated Value
Purchase Details
Closed on
May 22, 2020
Sold by
Grant Sue A and Barton Daniel Lee
Bought by
Grant James Eddie and Grant Justin Thomas
Purchase Details
Closed on
May 21, 2020
Sold by
Grant Sue A and Lee Daniel
Bought by
Grant James Eddie and Grant Justin Thomas
Create a Home Valuation Report for This Property
The Home Valuation Report is an in-depth analysis detailing your home's value as well as a comparison with similar homes in the area
Home Values in the Area
Average Home Value in this Area
Purchase History
| Date | Buyer | Sale Price | Title Company |
|---|---|---|---|
| Series Ten Of Jtg Llc | -- | None Listed On Document | |
| Grant James Eddie | -- | None Available | |
| Grant James Eddie | -- | None Listed On Document |
Source: Public Records
Tax History Compared to Growth
Tax History
| Year | Tax Paid | Tax Assessment Tax Assessment Total Assessment is a certain percentage of the fair market value that is determined by local assessors to be the total taxable value of land and additions on the property. | Land | Improvement |
|---|---|---|---|---|
| 2025 | $1,055 | $10,713 | $3,080 | $7,633 |
| 2024 | $1,055 | $10,203 | $2,933 | $7,270 |
| 2023 | $1,055 | $9,906 | $2,860 | $7,046 |
| 2022 | $1,028 | $9,906 | $2,860 | $7,046 |
| 2021 | $1,079 | $9,906 | $2,860 | $7,046 |
| 2020 | $367 | $4,021 | $1,682 | $2,339 |
| 2019 | $359 | $3,904 | $1,657 | $2,247 |
| 2018 | $339 | $3,791 | $1,582 | $2,209 |
| 2017 | $325 | $3,680 | $1,619 | $2,061 |
| 2016 | $313 | $3,572 | $1,591 | $1,981 |
| 2015 | $301 | $3,469 | $1,332 | $2,137 |
| 2014 | $285 | $3,368 | $1,532 | $1,836 |
Source: Public Records
Map
Nearby Homes