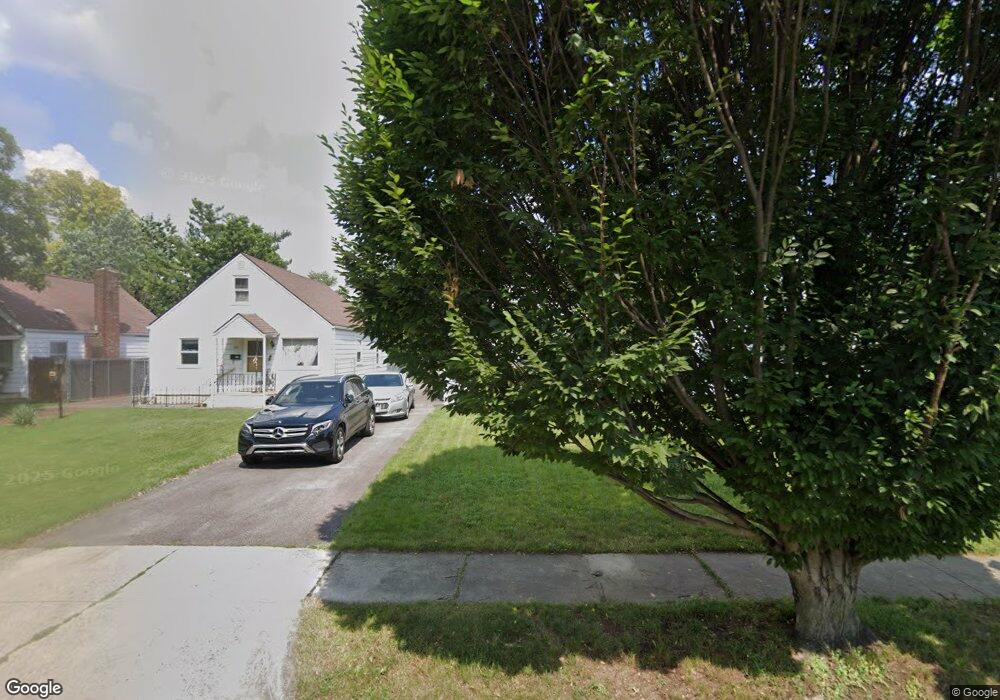
528 S Waverly St Columbus, OH 43213
Eastmoor NeighborhoodEstimated Value: $144,000 - $170,000
3
Beds
1
Bath
1,044
Sq Ft
$151/Sq Ft
Est. Value
About This Home
This home is located at 528 S Waverly St, Columbus, OH 43213 and is currently estimated at $157,419, approximately $150 per square foot. 528 S Waverly St is a home located in Franklin County with nearby schools including Fairmoor Elementary School, Johnson Park Middle School, and Walnut Ridge High School.
Ownership History
Date
Name
Owned For
Owner Type
Purchase Details
Closed on
Jun 30, 2006
Sold by
Mimnaugh Michael G and Mimnaugh Carrie A
Bought by
Agho Liliane
Current Estimated Value
Home Financials for this Owner
Home Financials are based on the most recent Mortgage that was taken out on this home.
Original Mortgage
$68,820
Outstanding Balance
$40,924
Interest Rate
6.68%
Mortgage Type
FHA
Estimated Equity
$116,495
Purchase Details
Closed on
Nov 29, 2005
Sold by
Fannie Mae
Bought by
Mimnaugh Carrie A and Mimnaugh Michael G
Purchase Details
Closed on
May 19, 2005
Sold by
Galbraith Randy A
Bought by
Federal National Mortgage Association
Purchase Details
Closed on
Jan 4, 1994
Purchase Details
Closed on
May 15, 1990
Create a Home Valuation Report for This Property
The Home Valuation Report is an in-depth analysis detailing your home's value as well as a comparison with similar homes in the area
Home Values in the Area
Average Home Value in this Area
Purchase History
| Date | Buyer | Sale Price | Title Company |
|---|---|---|---|
| Agho Liliane | $69,900 | Independent | |
| Mimnaugh Carrie A | $51,000 | Title First | |
| Federal National Mortgage Association | $50,000 | Ohio Title | |
| -- | $49,000 | -- | |
| -- | -- | -- |
Source: Public Records
Mortgage History
| Date | Status | Borrower | Loan Amount |
|---|---|---|---|
| Open | Agho Liliane | $68,820 |
Source: Public Records
Tax History Compared to Growth
Tax History
| Year | Tax Paid | Tax Assessment Tax Assessment Total Assessment is a certain percentage of the fair market value that is determined by local assessors to be the total taxable value of land and additions on the property. | Land | Improvement |
|---|---|---|---|---|
| 2024 | $3,018 | $45,020 | $11,660 | $33,360 |
| 2023 | $1,995 | $45,010 | $11,655 | $33,355 |
| 2022 | $2,435 | $29,690 | $5,080 | $24,610 |
| 2021 | $1,791 | $29,690 | $5,080 | $24,610 |
| 2020 | $1,626 | $29,690 | $5,080 | $24,610 |
| 2019 | $1,484 | $24,470 | $4,240 | $20,230 |
| 2018 | $1,395 | $24,470 | $4,240 | $20,230 |
| 2017 | $1,463 | $24,470 | $4,240 | $20,230 |
| 2016 | $1,442 | $21,770 | $3,780 | $17,990 |
| 2015 | $1,309 | $21,770 | $3,780 | $17,990 |
| 2014 | $1,312 | $21,770 | $3,780 | $17,990 |
| 2013 | $682 | $22,925 | $3,990 | $18,935 |
Source: Public Records
Map
Nearby Homes
- 646 S Weyant Ave
- 647 S Napoleon Ave
- 635 Elizabeth Ave
- 708 S Waverly St
- 711 S Waverly St
- 733 S Napoleon Ave
- 622 S Ashburton Rd
- 430 S James Rd
- 3160 Fair Ave
- 565 S Kellner Rd
- 836 S Weyant Ave
- 277 S James Rd
- 842 S Hampton Rd
- 247 S James Rd
- 526 Collingwood Ave
- 804 S Ashburton Rd
- 864 S Waverly St
- 201 S Weyant Ave
- 892 Ruby Ave
- 239 S Kellner Rd
- 532 S Waverly St
- 522 S Waverly St
- 518 S Waverly St
- 538 S Waverly St
- 512 S Waverly St
- 533 S Weyant Ave
- 529 S Weyant Ave
- 539 S Weyant Ave
- 506 S Waverly St
- 523 S Weyant Ave
- 545 S Weyant Ave
- 552 S Waverly St
- 523 S Waverly St
- 519 S Weyant Ave
- 529 S Waverly St
- 502 S Waverly St
- 517 S Waverly St
- 535 S Waverly St
- 511 S Waverly St
- 556 S Waverly St