Estimated Value: $213,000 - $238,000
3
Beds
1
Bath
878
Sq Ft
$253/Sq Ft
Est. Value
About This Home
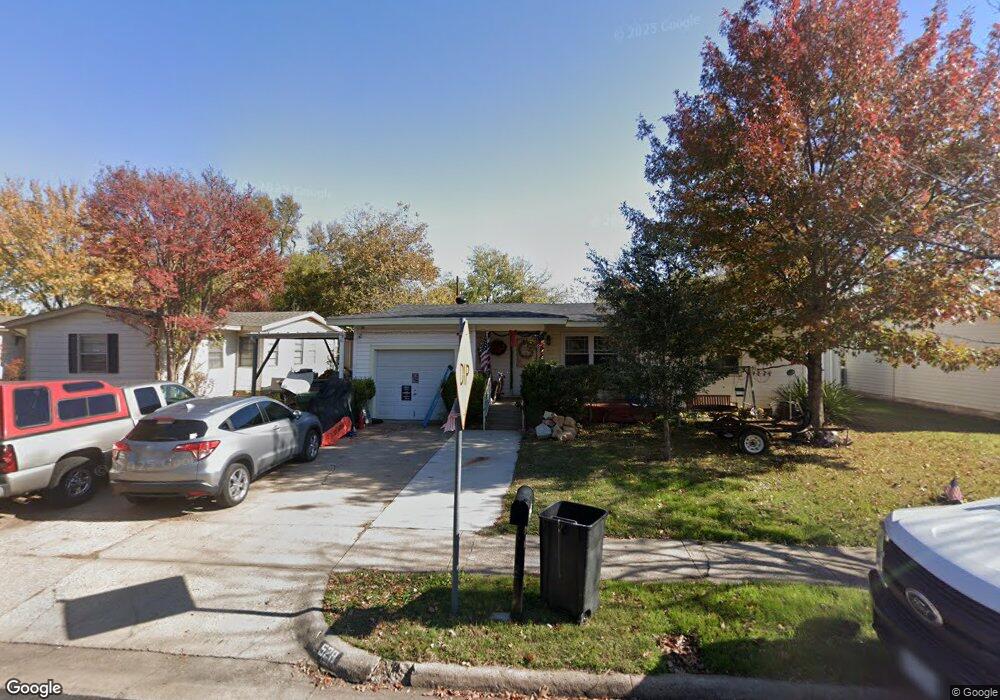
This home is located at 528 Souder Dr, Hurst, TX 76053 and is currently estimated at $222,011, approximately $252 per square foot. 528 Souder Dr is a home located in Tarrant County with nearby schools including Harrison Lane Elementary School, Hurst J High School, and L.D. Bell High School.
Ownership History
Date
Name
Owned For
Owner Type
Purchase Details
Closed on
Mar 30, 2016
Sold by
Pederson Holli Kristen
Bought by
Pederson Deborah Lynn
Current Estimated Value
Home Financials for this Owner
Home Financials are based on the most recent Mortgage that was taken out on this home.
Original Mortgage
$64,000
Outstanding Balance
$50,794
Interest Rate
3.65%
Mortgage Type
New Conventional
Estimated Equity
$171,217
Purchase Details
Closed on
Aug 10, 2007
Sold by
Box Karen Sue Pederson
Bought by
Pederson Holli K
Home Financials for this Owner
Home Financials are based on the most recent Mortgage that was taken out on this home.
Original Mortgage
$64,000
Interest Rate
6.64%
Mortgage Type
Purchase Money Mortgage
Create a Home Valuation Report for This Property
The Home Valuation Report is an in-depth analysis detailing your home's value as well as a comparison with similar homes in the area
Home Values in the Area
Average Home Value in this Area
Purchase History
| Date | Buyer | Sale Price | Title Company |
|---|---|---|---|
| Pederson Deborah Lynn | -- | None Available | |
| Pederson Holli K | -- | Alamo Title Company |
Source: Public Records
Mortgage History
| Date | Status | Borrower | Loan Amount |
|---|---|---|---|
| Open | Pederson Deborah Lynn | $64,000 | |
| Previous Owner | Pederson Holli K | $64,000 |
Source: Public Records
Tax History Compared to Growth
Tax History
| Year | Tax Paid | Tax Assessment Tax Assessment Total Assessment is a certain percentage of the fair market value that is determined by local assessors to be the total taxable value of land and additions on the property. | Land | Improvement |
|---|---|---|---|---|
| 2025 | $1,073 | $190,498 | $50,000 | $140,498 |
| 2024 | $1,073 | $190,498 | $50,000 | $140,498 |
| 2023 | $3,070 | $171,753 | $30,000 | $141,753 |
| 2022 | $3,207 | $161,222 | $30,000 | $131,222 |
| 2021 | $3,054 | $131,551 | $30,000 | $101,551 |
| 2020 | $2,770 | $119,545 | $30,000 | $89,545 |
| 2019 | $2,562 | $107,158 | $30,000 | $77,158 |
| 2018 | $1,837 | $95,149 | $19,000 | $76,149 |
| 2017 | $1,776 | $100,668 | $19,000 | $81,668 |
| 2016 | $1,614 | $85,633 | $19,000 | $66,633 |
| 2015 | $1,176 | $58,000 | $13,500 | $44,500 |
| 2014 | $1,176 | $58,000 | $13,500 | $44,500 |
Source: Public Records
Map
Nearby Homes