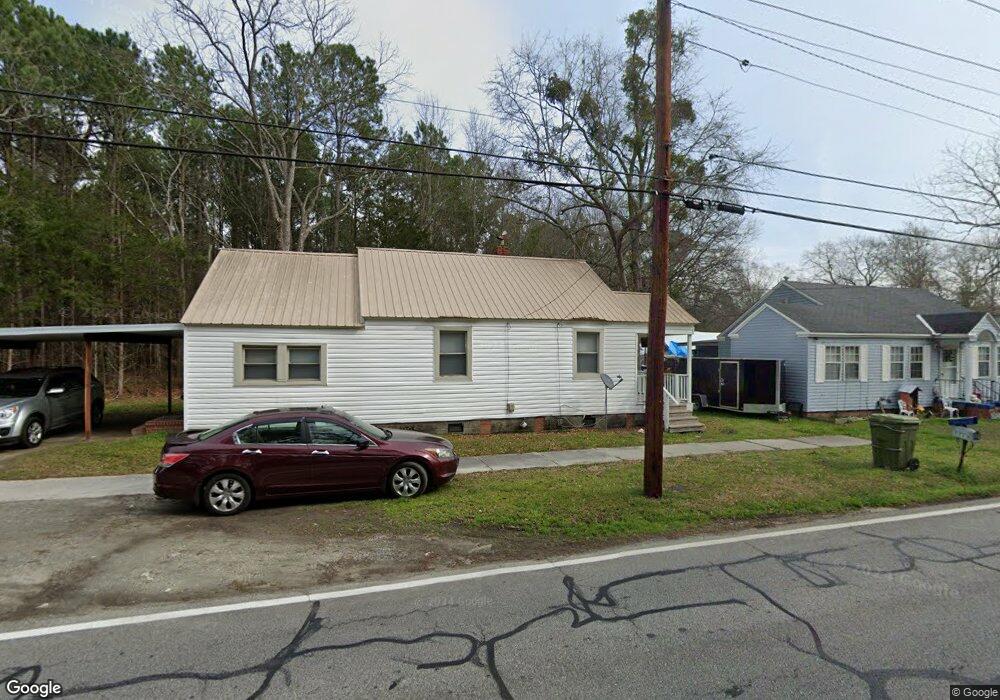
528 White Oak Rd Thomson, GA 30824
Estimated Value: $101,661 - $129,000
3
Beds
2
Baths
1,189
Sq Ft
$96/Sq Ft
Est. Value
About This Home
This home is located at 528 White Oak Rd, Thomson, GA 30824 and is currently estimated at $114,665, approximately $96 per square foot. 528 White Oak Rd is a home located in McDuffie County with nearby schools including Thomson High School.
Ownership History
Date
Name
Owned For
Owner Type
Purchase Details
Closed on
Oct 29, 2021
Sold by
Alfriend James P
Bought by
Daniel Will
Current Estimated Value
Purchase Details
Closed on
Jan 20, 2015
Sold by
Oaborne Jerome E
Bought by
Alfriend James P
Purchase Details
Closed on
Oct 22, 2013
Sold by
F & M Bank
Bought by
Oaborne Jerome E
Purchase Details
Closed on
Jun 28, 2013
Sold by
Sisson Properties Llc
Bought by
F & M Bank
Purchase Details
Closed on
Feb 11, 2010
Sold by
Reese Constance T
Bought by
Sisson Properties Llc
Home Financials for this Owner
Home Financials are based on the most recent Mortgage that was taken out on this home.
Original Mortgage
$37,178
Interest Rate
5%
Mortgage Type
Future Advance Clause Open End Mortgage
Purchase Details
Closed on
Mar 29, 1965
Bought by
Waller Mary S
Create a Home Valuation Report for This Property
The Home Valuation Report is an in-depth analysis detailing your home's value as well as a comparison with similar homes in the area
Home Values in the Area
Average Home Value in this Area
Purchase History
| Date | Buyer | Sale Price | Title Company |
|---|---|---|---|
| Daniel Will | $64,000 | -- | |
| Alfriend James P | $30,000 | -- | |
| Oaborne Jerome E | $21,500 | -- | |
| F & M Bank | $36,000 | -- | |
| Sisson Properties Llc | $36,000 | -- | |
| Waller Mary S | -- | -- |
Source: Public Records
Mortgage History
| Date | Status | Borrower | Loan Amount |
|---|---|---|---|
| Previous Owner | Sisson Properties Llc | $37,178 |
Source: Public Records
Tax History Compared to Growth
Tax History
| Year | Tax Paid | Tax Assessment Tax Assessment Total Assessment is a certain percentage of the fair market value that is determined by local assessors to be the total taxable value of land and additions on the property. | Land | Improvement |
|---|---|---|---|---|
| 2025 | $1,262 | $40,184 | $1,344 | $38,840 |
| 2024 | $1,262 | $38,184 | $1,280 | $36,904 |
| 2023 | $1,089 | $36,396 | $960 | $35,436 |
| 2022 | $892 | $27,132 | $768 | $26,364 |
| 2021 | $763 | $21,688 | $1,024 | $20,664 |
| 2020 | $535 | $15,254 | $798 | $14,456 |
| 2019 | $543 | $15,344 | $798 | $14,546 |
| 2018 | $548 | $15,344 | $798 | $14,546 |
| 2017 | $534 | $15,344 | $798 | $14,546 |
| 2016 | $420 | $15,344 | $798 | $14,546 |
| 2015 | $555 | $17,859 | $1,228 | $16,631 |
| 2014 | $268 | $14,631 | $1,228 | $13,403 |
| 2013 | -- | $14,630 | $1,228 | $13,402 |
Source: Public Records
Map
Nearby Homes
- 431 Edgar Cir
- 314 White Oak St
- 629 Clary St
- 305 Gordon St
- 211 Deans Aly
- 212 Whitehead St
- 0 Harrison Rd Unit 543150
- 2051 April Dawn Trail
- 641 Ellington Ave
- 1032 Debutant Dr
- 421 Salem Rd
- Bentcreek II Plan at Camellia Park
- Devonshire ll Plan at Camellia Park
- Dahlia II Plan at Camellia Park
- Harper II Plan at Camellia Park
- Buck Island II Plan at Camellia Park
- Porter II Plan at Camellia Park
- Benton II Plan at Camellia Park
- Wisteria II Plan at Camellia Park
- Bradley II Plan at Camellia Park
- 528 White Oak Rd
- 530 White Oak Rd
- 532 White Oak Rd
- 536 White Oak Rd
- 536 White Oak Rd
- 111 Ellington Ave
- 538 White Oak Rd
- 540 White Oak Rd
- 206 Ellington Ave
- 110 Ellington Ave
- 106 Ellington Ave
- 108 Ellington Ave
- 543 White Oak Rd
- 00 Whiteoak St
- 516 Railroad St
- 545 White Oak Rd
- 524 Railroad St
- 216 Ellington Ave
- 210 Ellington Ave
- 516 Holt St