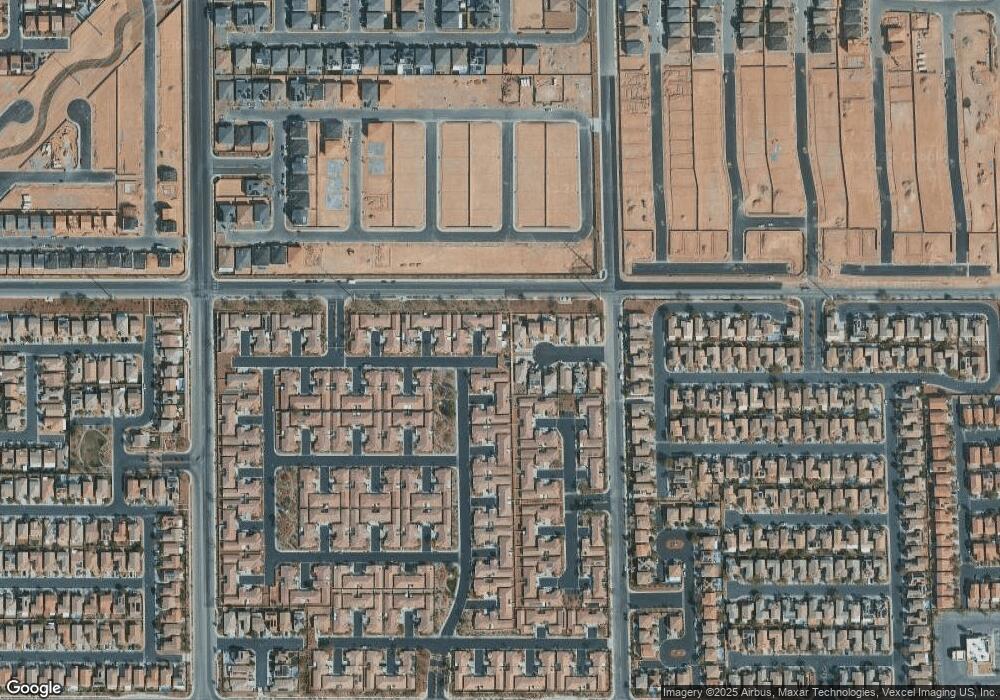
5280 Cholla Cactus Ave Las Vegas, NV 89141
Highlands Ranch NeighborhoodEstimated Value: $343,146 - $378,000
3
Beds
2
Baths
1,202
Sq Ft
$305/Sq Ft
Est. Value
About This Home
This home is located at 5280 Cholla Cactus Ave, Las Vegas, NV 89141 and is currently estimated at $366,287, approximately $304 per square foot. 5280 Cholla Cactus Ave is a home located in Clark County with nearby schools including Aldeane Comito Ries Elementary School, Lois & Jerry Tarkanian Middle School, and Desert Oasis High School.
Ownership History
Date
Name
Owned For
Owner Type
Purchase Details
Closed on
Jan 19, 2007
Sold by
D R Horton Inc
Bought by
Schellhase Maria and Maria Schellhase Living Trust
Current Estimated Value
Home Financials for this Owner
Home Financials are based on the most recent Mortgage that was taken out on this home.
Original Mortgage
$216,000
Outstanding Balance
$128,289
Interest Rate
6.1%
Mortgage Type
Unknown
Estimated Equity
$237,998
Create a Home Valuation Report for This Property
The Home Valuation Report is an in-depth analysis detailing your home's value as well as a comparison with similar homes in the area
Home Values in the Area
Average Home Value in this Area
Purchase History
| Date | Buyer | Sale Price | Title Company |
|---|---|---|---|
| Schellhase Maria | $270,000 | Dhi Title |
Source: Public Records
Mortgage History
| Date | Status | Borrower | Loan Amount |
|---|---|---|---|
| Open | Schellhase Maria | $216,000 |
Source: Public Records
Tax History Compared to Growth
Tax History
| Year | Tax Paid | Tax Assessment Tax Assessment Total Assessment is a certain percentage of the fair market value that is determined by local assessors to be the total taxable value of land and additions on the property. | Land | Improvement |
|---|---|---|---|---|
| 2025 | $1,264 | $92,968 | $34,650 | $58,318 |
| 2024 | $1,228 | $92,968 | $34,650 | $58,318 |
| 2023 | $1,228 | $80,063 | $26,950 | $53,113 |
| 2022 | $1,192 | $75,363 | $25,025 | $50,338 |
| 2021 | $1,157 | $63,040 | $21,700 | $41,340 |
| 2020 | $1,121 | $64,441 | $21,350 | $43,091 |
| 2019 | $1,084 | $61,815 | $19,250 | $42,565 |
| 2018 | $1,053 | $55,120 | $14,350 | $40,770 |
| 2017 | $1,573 | $53,633 | $12,950 | $40,683 |
| 2016 | $998 | $52,927 | $10,500 | $42,427 |
| 2015 | $995 | $41,467 | $7,000 | $34,467 |
| 2014 | $964 | $31,895 | $5,250 | $26,645 |
Source: Public Records
Map
Nearby Homes
- 5250 Chester Creek Ct
- 5328 Cholla Cactus Ave
- 5409 Blue Oat Ave
- 10349 Aloe Cactus St
- 5092 Moose Falls Dr
- 10428 Mulvaney Cir
- 5418 Sand Dollar Ave
- 10197 Magnolia Creek St
- 10272 Beckenham Hills St
- 10189 Magnolia Creek St
- 5023 Tunnel Falls Dr
- 10114 Kettle Valley St
- 10470 Mulvaney Cir
- 5524 Markley Ave
- Shelby Plan at Hayford Collection
- Layton Plan at Hayford Collection
- Cameron Plan at Hayford Collection
- Kitchell Plan at Hayford Collection
- 5037 Lower Falls Ct
- 5546 Danforth Ave
- 5286 Cholla Cactus Ave
- 5260 Chester Creek Ct
- 10330 Melon Cactus St
- 5310 Cholla Cactus Ave
- 10324 Melon Cactus St
- 5298 Cholla Cactus Ave
- 10336 Melon Cactus St
- 5304 Cholla Cactus Ave
- 5249 Chester Creek Ct
- 5240 Chester Creek Ct
- 5316 Cholla Cactus Ave
- 5316 Cholla Cactus Ave Unit no unit
- 5322 Cholla Cactus Ave
- 10342 Melon Cactus St
- 5239 Chester Creek Ct
- 10359 Madagascar Palm St
- 10348 Melon Cactus St
- 5230 Chester Creek Ct
- 10354 Melon Cactus St
