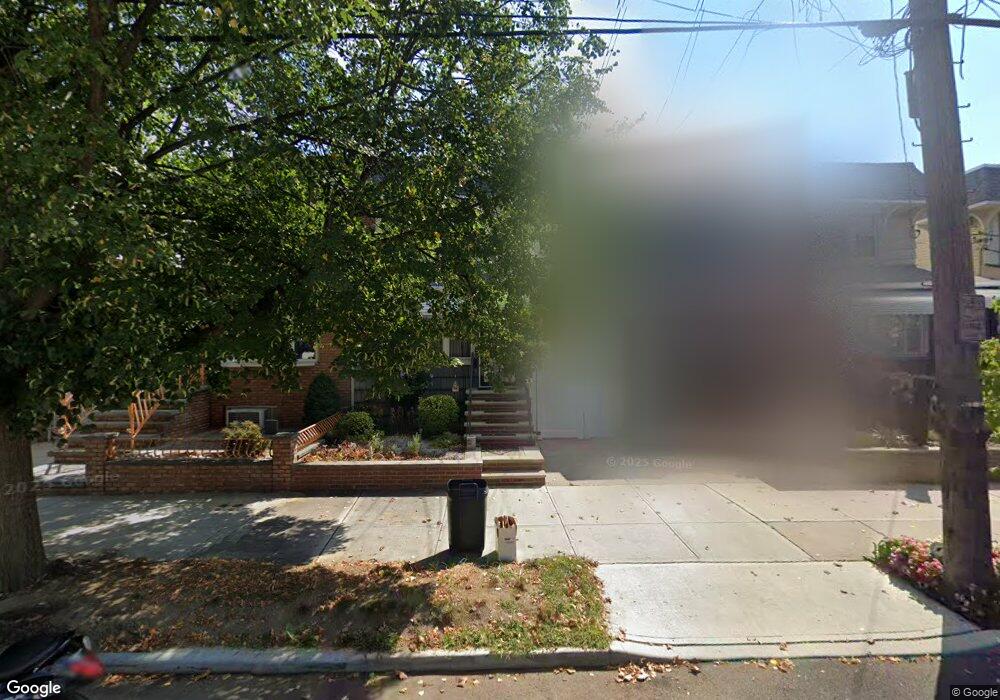
5281 70th St Maspeth, NY 11378
Maspeth NeighborhoodEstimated Value: $739,000 - $820,000
Studio
--
Bath
1,152
Sq Ft
$683/Sq Ft
Est. Value
About This Home
This home is located at 5281 70th St, Maspeth, NY 11378 and is currently estimated at $787,264, approximately $683 per square foot. 5281 70th St is a home located in Queens County with nearby schools including P.S. 229 Emanuel Kaplan, IS 73 - The Frank Sansivieri School, and Grover Cleveland High School.
Ownership History
Date
Name
Owned For
Owner Type
Purchase Details
Closed on
Dec 6, 2021
Sold by
Torres Maryann C
Bought by
Qiu Lingli
Current Estimated Value
Home Financials for this Owner
Home Financials are based on the most recent Mortgage that was taken out on this home.
Original Mortgage
$564,000
Outstanding Balance
$516,667
Interest Rate
3.12%
Mortgage Type
Purchase Money Mortgage
Estimated Equity
$270,597
Purchase Details
Closed on
Dec 18, 1998
Sold by
Torres Maryann C and Porembski Rita B
Bought by
Torres Maryann C
Home Financials for this Owner
Home Financials are based on the most recent Mortgage that was taken out on this home.
Original Mortgage
$27,166
Interest Rate
6.74%
Purchase Details
Closed on
Sep 30, 1996
Sold by
Perrone Karen
Bought by
Torres Maryann C and Porembski Rita B
Home Financials for this Owner
Home Financials are based on the most recent Mortgage that was taken out on this home.
Original Mortgage
$121,500
Interest Rate
7.99%
Create a Home Valuation Report for This Property
The Home Valuation Report is an in-depth analysis detailing your home's value as well as a comparison with similar homes in the area
Home Values in the Area
Average Home Value in this Area
Purchase History
| Date | Buyer | Sale Price | Title Company |
|---|---|---|---|
| Qiu Lingli | $705,000 | -- | |
| Qiu Lingli | $705,000 | -- | |
| Qiu Lingli | $705,000 | -- | |
| Torres Maryann C | -- | Ticor Title Guarantee Compan | |
| Torres Maryann C | -- | Ticor Title Guarantee Compan | |
| Torres Maryann C | $135,000 | Commonwealth Land Title Ins | |
| Torres Maryann C | $135,000 | Commonwealth Land Title Ins |
Source: Public Records
Mortgage History
| Date | Status | Borrower | Loan Amount |
|---|---|---|---|
| Open | Qiu Lingli | $564,000 | |
| Closed | Qiu Lingli | $564,000 | |
| Previous Owner | Torres Maryann C | $27,166 | |
| Previous Owner | Torres Maryann C | $121,500 |
Source: Public Records
Tax History
| Year | Tax Paid | Tax Assessment Tax Assessment Total Assessment is a certain percentage of the fair market value that is determined by local assessors to be the total taxable value of land and additions on the property. | Land | Improvement |
|---|---|---|---|---|
| 2025 | $5,958 | $30,954 | $6,694 | $24,260 |
| 2024 | $5,958 | $29,665 | $6,480 | $23,185 |
| 2023 | $5,699 | $28,373 | $5,267 | $23,106 |
| 2022 | $5,403 | $46,560 | $10,380 | $36,180 |
| 2021 | $5,133 | $44,940 | $10,380 | $34,560 |
| 2020 | $5,164 | $38,640 | $10,380 | $28,260 |
| 2019 | $4,879 | $40,860 | $10,380 | $30,480 |
| 2018 | $4,522 | $23,644 | $6,431 | $17,213 |
| 2017 | $4,302 | $22,572 | $6,149 | $16,423 |
| 2016 | $3,987 | $22,572 | $6,149 | $16,423 |
| 2015 | $2,349 | $21,496 | $7,657 | $13,839 |
| 2014 | $2,349 | $20,601 | $7,563 | $13,038 |
Source: Public Records
Map
Nearby Homes
Your Personal Tour Guide
Ask me questions while you tour the home.