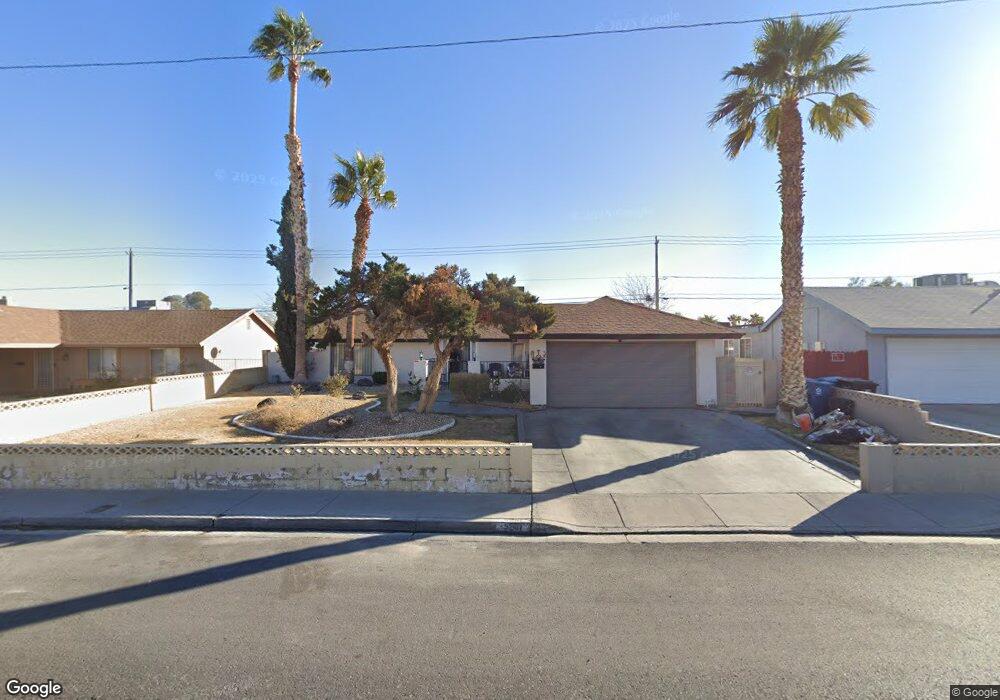
5281 Edna Ave Las Vegas, NV 89146
Estimated Value: $416,303 - $434,000
3
Beds
2
Baths
1,596
Sq Ft
$266/Sq Ft
Est. Value
About This Home
This home is located at 5281 Edna Ave, Las Vegas, NV 89146 and is currently estimated at $425,076, approximately $266 per square foot. 5281 Edna Ave is a home located in Clark County with nearby schools including Dr. C Owen Roundy Elementary School, Elaine Wynn Elementary School, and Kenny C Guinn Middle School.
Ownership History
Date
Name
Owned For
Owner Type
Purchase Details
Closed on
Jan 27, 2011
Sold by
Velazquez Ernesto and Velazquez Patricia
Bought by
Velazquez Patricia
Current Estimated Value
Purchase Details
Closed on
Mar 15, 2006
Sold by
Velazquez Ernesto and Velazquez Patricia
Bought by
Velasquez Ernesto and Velazquez Patricia
Home Financials for this Owner
Home Financials are based on the most recent Mortgage that was taken out on this home.
Original Mortgage
$207,200
Outstanding Balance
$117,170
Interest Rate
6.18%
Mortgage Type
New Conventional
Estimated Equity
$307,906
Purchase Details
Closed on
Jul 27, 1999
Sold by
Beck Irene
Bought by
Velasquez Ernesto and Velasquez Patricia
Home Financials for this Owner
Home Financials are based on the most recent Mortgage that was taken out on this home.
Original Mortgage
$114,823
Interest Rate
7.64%
Mortgage Type
FHA
Create a Home Valuation Report for This Property
The Home Valuation Report is an in-depth analysis detailing your home's value as well as a comparison with similar homes in the area
Home Values in the Area
Average Home Value in this Area
Purchase History
| Date | Buyer | Sale Price | Title Company |
|---|---|---|---|
| Velazquez Patricia | -- | None Available | |
| Velasquez Ernesto | -- | Fidelity National Title | |
| Velasquez Ernesto | $115,000 | Land Title |
Source: Public Records
Mortgage History
| Date | Status | Borrower | Loan Amount |
|---|---|---|---|
| Open | Velasquez Ernesto | $207,200 | |
| Closed | Velasquez Ernesto | $114,823 |
Source: Public Records
Tax History Compared to Growth
Tax History
| Year | Tax Paid | Tax Assessment Tax Assessment Total Assessment is a certain percentage of the fair market value that is determined by local assessors to be the total taxable value of land and additions on the property. | Land | Improvement |
|---|---|---|---|---|
| 2025 | $1,523 | $62,867 | $35,700 | $27,167 |
| 2024 | $1,480 | $62,867 | $35,700 | $27,167 |
| 2023 | $1,166 | $59,472 | $35,000 | $24,472 |
| 2022 | $1,493 | $50,287 | $28,350 | $21,937 |
| 2021 | $1,622 | $47,173 | $25,550 | $21,623 |
| 2020 | $1,064 | $45,672 | $23,450 | $22,222 |
| 2019 | $997 | $42,531 | $19,950 | $22,581 |
| 2018 | $952 | $40,549 | $18,200 | $22,349 |
| 2017 | $1,144 | $39,011 | $15,750 | $23,261 |
| 2016 | $1,166 | $36,033 | $11,550 | $24,483 |
| 2015 | $1,163 | $33,230 | $8,750 | $24,480 |
| 2014 | $1,135 | $28,493 | $5,950 | $22,543 |
Source: Public Records
Map
Nearby Homes
- 5336 Regal Ave
- 5414 Stampa Ave
- 2814 Edmond St Unit 2
- 5045 Stampa Ave
- 5048 Via de Palma Dr
- 5175 Palmyra Ave
- 5070 Tara Ave Unit 103
- 5181 Eldora Ave
- 3090 Westwind Rd
- 2671 Topaz Blue St
- 2691 Rimpacific Cir
- 5117 Eldora Ave Unit 4
- 5785 Edna Ave
- 3212 Moonflower Dr
- 5006 Schumann Dr
- 0 Palmyra Unit 2715168
- 2675 Westwind Rd
- 3214 Anacapa Way
- 2645 Lindell Rd
- 2885 Duneville St
- 5297 Edna Ave
- 5265 Edna Ave
- 5282 Stampa Ave
- 5266 Stampa Ave
- 5298 Stampa Ave
- 5249 Edna Ave Unit 2
- 5315 Edna Ave
- 5250 Stampa Ave
- 5316 Stampa Ave
- 5266 Monterey Park Cir
- 5310 Edna Ave
- 5320 Edna Ave
- 5233 Edna Ave
- 5333 Edna Ave
- 5270 Monterey Park Cir
- 5262 Monterey Park Cir
- 5234 Stampa Ave
- 5330 Edna Ave
- 5334 Stampa Ave
- 5274 Monterey Park Cir