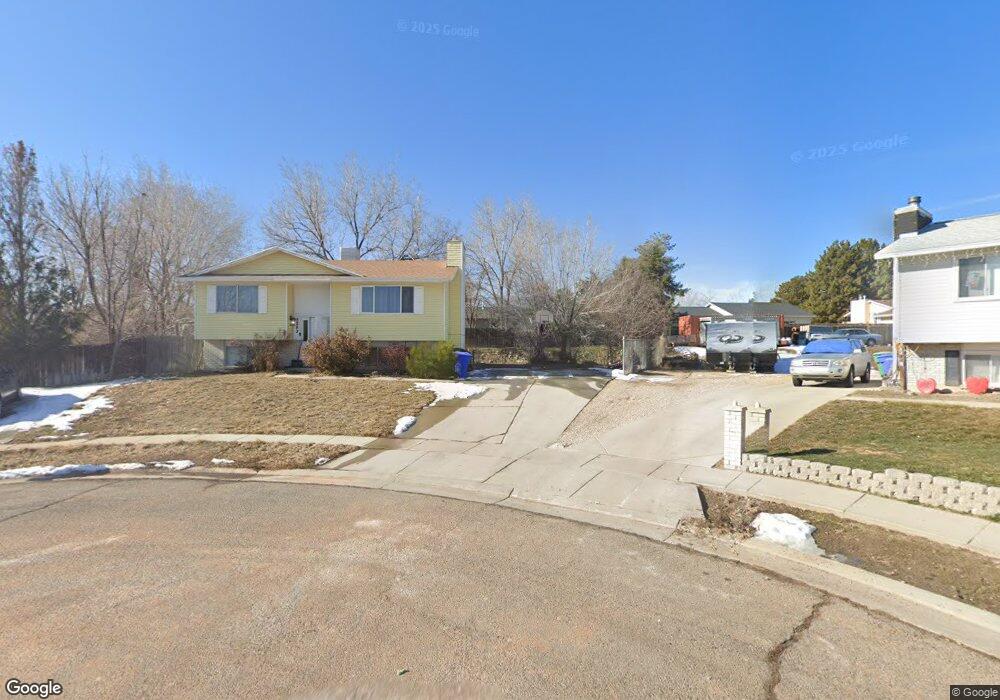
5283 Begonia Cir West Jordan, UT 84081
Oquirrh NeighborhoodEstimated Value: $444,000 - $485,000
4
Beds
2
Baths
1,900
Sq Ft
$242/Sq Ft
Est. Value
About This Home
This home is located at 5283 Begonia Cir, West Jordan, UT 84081 and is currently estimated at $460,690, approximately $242 per square foot. 5283 Begonia Cir is a home located in Salt Lake County with nearby schools including Jim Bridger Elementary School, Thomas Jefferson Jr High School, and Kearns High School.
Ownership History
Date
Name
Owned For
Owner Type
Purchase Details
Closed on
Nov 24, 2021
Sold by
Elwood Alexander James and Ramirez Alexandria Victoria
Bought by
Elwood Alexander and Ramirez Alexandria
Current Estimated Value
Home Financials for this Owner
Home Financials are based on the most recent Mortgage that was taken out on this home.
Original Mortgage
$197,000
Outstanding Balance
$180,766
Interest Rate
3.09%
Mortgage Type
New Conventional
Estimated Equity
$279,924
Purchase Details
Closed on
May 24, 2017
Sold by
Bellenger Christopher B
Bought by
Elwood Alexander James and Ramirez Alexandria Victoria
Home Financials for this Owner
Home Financials are based on the most recent Mortgage that was taken out on this home.
Original Mortgage
$226,010
Interest Rate
4.08%
Mortgage Type
New Conventional
Purchase Details
Closed on
Jul 15, 2013
Sold by
Drake Tim and Drake Vanella
Bought by
Bellenger Christopher B
Home Financials for this Owner
Home Financials are based on the most recent Mortgage that was taken out on this home.
Original Mortgage
$150,228
Interest Rate
4.37%
Mortgage Type
FHA
Purchase Details
Closed on
Dec 7, 2010
Sold by
Steed James and Young Andrea
Bought by
Drake Tim and Drake Vanella
Home Financials for this Owner
Home Financials are based on the most recent Mortgage that was taken out on this home.
Original Mortgage
$6,600
Interest Rate
4.17%
Mortgage Type
Stand Alone Second
Purchase Details
Closed on
Apr 30, 2003
Sold by
Benner Brian and Benner Brandee
Bought by
Steed James and Steed Andrea
Home Financials for this Owner
Home Financials are based on the most recent Mortgage that was taken out on this home.
Original Mortgage
$115,400
Interest Rate
5.72%
Purchase Details
Closed on
Oct 27, 1995
Sold by
Fuentes Cyndie L Allred
Bought by
Benner Brian and Benner Brandee
Home Financials for this Owner
Home Financials are based on the most recent Mortgage that was taken out on this home.
Original Mortgage
$89,417
Interest Rate
7.59%
Mortgage Type
FHA
Purchase Details
Closed on
Jul 20, 1995
Sold by
Allred Cyndie L
Bought by
Fuentes Cyndie L Allred
Home Financials for this Owner
Home Financials are based on the most recent Mortgage that was taken out on this home.
Original Mortgage
$10,895
Interest Rate
7.59%
Purchase Details
Closed on
Feb 18, 1994
Sold by
Allred Campbell Cyndie L
Bought by
Allred Cyndie L
Home Financials for this Owner
Home Financials are based on the most recent Mortgage that was taken out on this home.
Original Mortgage
$42,174
Interest Rate
6.98%
Mortgage Type
FHA
Create a Home Valuation Report for This Property
The Home Valuation Report is an in-depth analysis detailing your home's value as well as a comparison with similar homes in the area
Home Values in the Area
Average Home Value in this Area
Purchase History
| Date | Buyer | Sale Price | Title Company |
|---|---|---|---|
| Elwood Alexander | -- | Metro National Title | |
| Elwood Alexander James | -- | Old Republic Title | |
| Bellenger Christopher B | -- | Title One | |
| Drake Tim | -- | Red Rock Title Ins Agcy Llc | |
| Steed James | -- | Title One | |
| Benner Brian | -- | -- | |
| Fuentes Cyndie L Allred | -- | -- | |
| Allred Cyndie L | -- | -- |
Source: Public Records
Mortgage History
| Date | Status | Borrower | Loan Amount |
|---|---|---|---|
| Open | Elwood Alexander | $197,000 | |
| Closed | Elwood Alexander James | $226,010 | |
| Previous Owner | Bellenger Christopher B | $150,228 | |
| Previous Owner | Drake Tim | $6,600 | |
| Previous Owner | Drake Tim | $118,907 | |
| Previous Owner | Steed James | $115,400 | |
| Previous Owner | Benner Brian | $89,417 | |
| Previous Owner | Fuentes Cyndie L Allred | $10,895 | |
| Previous Owner | Allred Cyndie L | $42,174 |
Source: Public Records
Tax History Compared to Growth
Tax History
| Year | Tax Paid | Tax Assessment Tax Assessment Total Assessment is a certain percentage of the fair market value that is determined by local assessors to be the total taxable value of land and additions on the property. | Land | Improvement |
|---|---|---|---|---|
| 2025 | $2,677 | $448,000 | $137,300 | $310,700 |
| 2024 | $2,677 | $422,100 | $129,500 | $292,600 |
| 2023 | $2,632 | $395,200 | $124,500 | $270,700 |
| 2022 | $2,536 | $387,300 | $122,100 | $265,200 |
| 2021 | $2,323 | $315,300 | $93,900 | $221,400 |
| 2020 | $2,359 | $273,400 | $93,900 | $179,500 |
| 2019 | $2,098 | $261,500 | $88,600 | $172,900 |
| 2018 | $1,991 | $239,600 | $88,600 | $151,000 |
| 2017 | $1,545 | $195,700 | $88,600 | $107,100 |
| 2016 | $1,427 | $179,600 | $88,600 | $91,000 |
| 2015 | $1,472 | $172,400 | $84,800 | $87,600 |
| 2014 | $1,444 | $165,900 | $82,200 | $83,700 |
Source: Public Records
Map
Nearby Homes
- 5271 W Begonia Cir
- 6568 S 5180 W
- 6312 S Cosmo Dr
- 5183 W Cadenza Dr
- 6398 S Lobelia Dr
- 5281 Saguaro Dr
- 5198 Crus Corvi Rd
- 6437 S Lobelia Dr
- 5382 W Northlilac Ave
- 5352 Cassatt Cir
- 6706 Marshrock Rd
- 5557 W Joshua Cir
- 6839 S Cyclamen Dr
- 4909 Sakura Ct
- 5466 Ticklegrass Rd
- 5275 Ridge Flower Way
- 6853 Mullien Dr Unit 5420
- 5071 W Jarrad Rd
- 4983 Shooting Star Ave
- 4227 S Hopi Dr
- 5283 W Begonia Cir
- 5277 Begonia Cir
- 5277 W Begonia Cir
- 6449 Clernates Dr
- 6449 S Clernates Dr
- 6439 Clernates Dr
- 5280 Begonia Cir
- 6459 Clernates Dr
- 6429 Clernates Dr
- 6429 S Clernates Dr
- 5271 Begonia Cir
- 5280 W Banquet Ave
- 5280 Banquet Ave
- 5278 Begonia Cir
- 5278 W Begonia Cir
- 5270 W Banquet Ave
- 5270 Banquet Ave
- 6411 Clernates Dr
- 5270 Begonia Cir
- 6411 S Clernates Dr