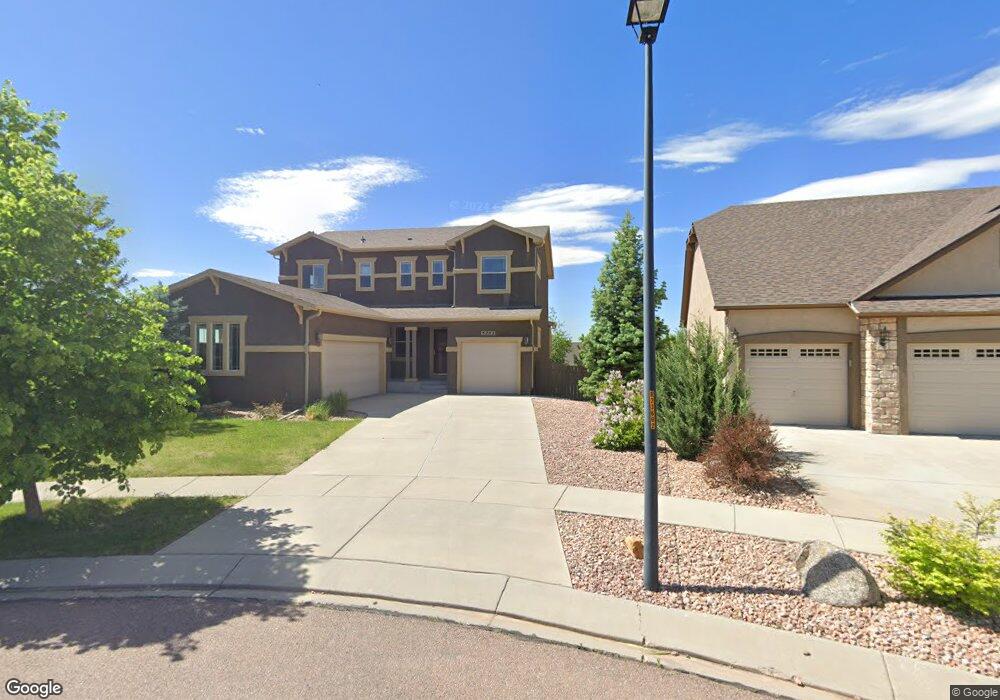
5283 Imogene Pass Place Colorado Springs, CO 80924
Wolf Ranch NeighborhoodEstimated Value: $717,106 - $798,000
5
Beds
3
Baths
2,365
Sq Ft
$318/Sq Ft
Est. Value
About This Home
This home is located at 5283 Imogene Pass Place, Colorado Springs, CO 80924 and is currently estimated at $751,027, approximately $317 per square foot. 5283 Imogene Pass Place is a home located in El Paso County with nearby schools including Chinook Trail Elementary School, Challenger Middle School, and Pine Creek High School.
Ownership History
Date
Name
Owned For
Owner Type
Purchase Details
Closed on
Jun 9, 2022
Sold by
Michalak Family Living Trust
Bought by
Tava Adil Markus and Tava Sarah
Current Estimated Value
Home Financials for this Owner
Home Financials are based on the most recent Mortgage that was taken out on this home.
Original Mortgage
$528,750
Outstanding Balance
$503,020
Interest Rate
5.25%
Mortgage Type
New Conventional
Estimated Equity
$248,007
Purchase Details
Closed on
Oct 25, 2011
Sold by
Michalak Matthew J and Michalak Lori A
Bought by
Michalak Mathew J and Michalak Lori A
Purchase Details
Closed on
Apr 27, 2011
Sold by
Vantage Homes Corp
Bought by
Michalak Matthew and Michalak Lori
Home Financials for this Owner
Home Financials are based on the most recent Mortgage that was taken out on this home.
Original Mortgage
$341,862
Interest Rate
4.82%
Mortgage Type
New Conventional
Purchase Details
Closed on
Dec 20, 2010
Sold by
High Valley Land Company Inc
Bought by
Vantage Homes Corp
Create a Home Valuation Report for This Property
The Home Valuation Report is an in-depth analysis detailing your home's value as well as a comparison with similar homes in the area
Home Values in the Area
Average Home Value in this Area
Purchase History
| Date | Buyer | Sale Price | Title Company |
|---|---|---|---|
| Tava Adil Markus | $705,000 | None Listed On Document | |
| Michalak Mathew J | -- | None Available | |
| Michalak Matthew | $359,855 | Land Title Guarantee Company | |
| Vantage Homes Corp | $75,000 | Land Title Guarantee Company |
Source: Public Records
Mortgage History
| Date | Status | Borrower | Loan Amount |
|---|---|---|---|
| Open | Tava Adil Markus | $528,750 | |
| Previous Owner | Michalak Matthew | $341,862 |
Source: Public Records
Tax History Compared to Growth
Tax History
| Year | Tax Paid | Tax Assessment Tax Assessment Total Assessment is a certain percentage of the fair market value that is determined by local assessors to be the total taxable value of land and additions on the property. | Land | Improvement |
|---|---|---|---|---|
| 2025 | $2,783 | $52,580 | -- | -- |
| 2024 | $2,771 | $50,100 | $8,040 | $42,060 |
| 2022 | $2,492 | $37,660 | $7,390 | $30,270 |
| 2021 | $2,943 | $38,740 | $7,600 | $31,140 |
| 2020 | $3,213 | $36,110 | $6,610 | $29,500 |
| 2019 | $3,184 | $36,110 | $6,610 | $29,500 |
| 2018 | $2,504 | $27,970 | $5,390 | $22,580 |
| 2017 | $2,495 | $27,970 | $5,390 | $22,580 |
| 2016 | $2,511 | $28,110 | $5,870 | $22,240 |
| 2015 | $2,506 | $28,110 | $5,870 | $22,240 |
| 2014 | $2,343 | $26,260 | $5,600 | $20,660 |
Source: Public Records
Map
Nearby Homes
- 5420 Paddington Creek Place
- 5480 Leon Young Dr
- 9613 Surrey Run Dr
- 5763 Thurber Dr
- 5218 Eldorado Canyon Ct
- 5071 Farris Creek Ct
- 5747 Leon Young Dr
- Mountain Plan at Wolf Ranch - Cadence Collection
- Hillside Mesa Duo 5 Plan at Wolf Ranch - Cadence Collection
- Mesa Plan at Wolf Ranch - Cadence Collection
- Valley Duo 1.1 Plan at Wolf Ranch - Cadence Collection
- Mountain Hillside Duo 3 Plan at Wolf Ranch - Cadence Collection
- Peak Mountain Duo 3 Plan at Wolf Ranch - Cadence Collection
- Mountain Hillside Duo 4 Plan at Wolf Ranch - Cadence Collection
- Hillside Plan at Wolf Ranch - Cadence Collection
- Peak Mountain Duo 2 Plan at Wolf Ranch - Cadence Collection
- Hillside Mesa Duo 4 Plan at Wolf Ranch - Cadence Collection
- Valley Duo 1.2 Plan at Wolf Ranch - Cadence Collection
- Brooks Plan at Wolf Ranch - Classic Collection
- Monarch Plan at Wolf Ranch - Classic Collection
- 5293 Imogene Pass Place
- 5273 Imogene Pass Place
- 5266 Chimney Gulch Way
- 5263 Imogene Pass Place
- 5256 Chimney Gulch Way
- 5294 Imogene Pass Place
- 5246 Chimney Gulch Way
- 5253 Imogene Pass Place
- 5296 Chimney Gulch Way
- 5274 Imogene Pass Place
- 5522 Thurber Dr
- 5264 Imogene Pass Place
- 5243 Imogene Pass Place
- 5523 Thurber Dr
- 5236 Chimney Gulch Way
- 5254 Imogene Pass Place
- 5505 Tonbridge Place
- 5265 Chimney Gulch Way
- 5534 Thurber Dr
- 5255 Chimney Gulch Way