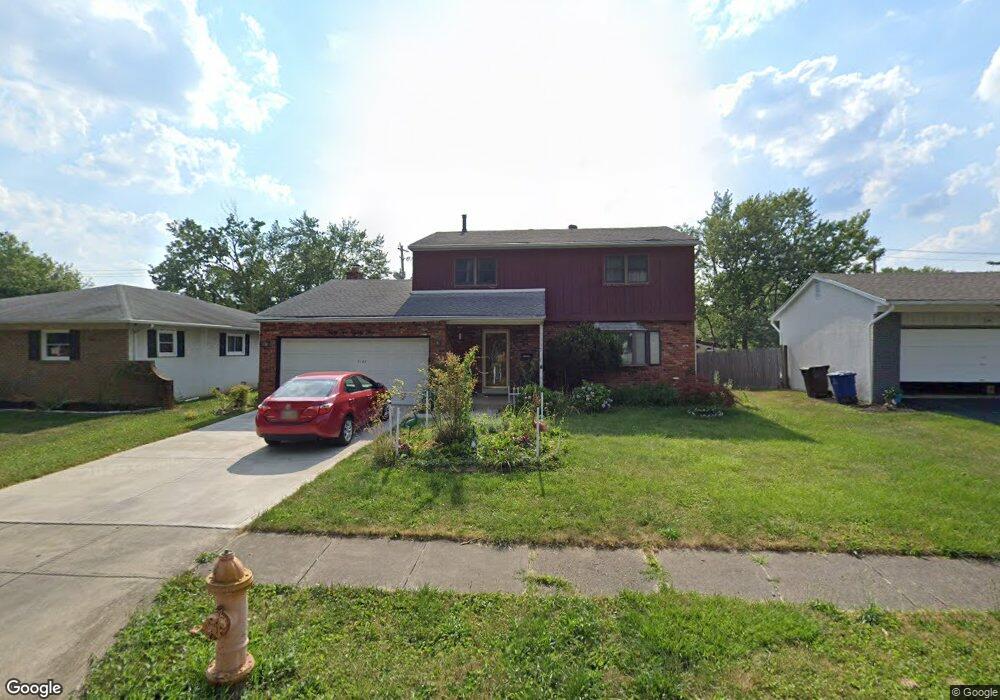
5285 Arrowood Loop W Columbus, OH 43229
Forest Park East NeighborhoodEstimated Value: $267,000 - $348,000
4
Beds
3
Baths
1,821
Sq Ft
$170/Sq Ft
Est. Value
About This Home
This home is located at 5285 Arrowood Loop W, Columbus, OH 43229 and is currently estimated at $309,204, approximately $169 per square foot. 5285 Arrowood Loop W is a home located in Franklin County with nearby schools including Parkmoor Elementary School, Woodward Park Middle School, and Northland High School.
Ownership History
Date
Name
Owned For
Owner Type
Purchase Details
Closed on
Feb 8, 2010
Sold by
Federal Home Loan Mortgage Corporation
Bought by
Eyong Takem Scholar N and Eyong Takem
Current Estimated Value
Home Financials for this Owner
Home Financials are based on the most recent Mortgage that was taken out on this home.
Original Mortgage
$88,369
Interest Rate
5.1%
Mortgage Type
FHA
Purchase Details
Closed on
Dec 14, 2009
Sold by
Greathouse Nancy I and Case #09Cve 02 02284
Bought by
Federal Home Loan Mortgage Corporation
Home Financials for this Owner
Home Financials are based on the most recent Mortgage that was taken out on this home.
Original Mortgage
$88,369
Interest Rate
5.1%
Mortgage Type
FHA
Purchase Details
Closed on
Apr 29, 1994
Purchase Details
Closed on
Nov 22, 1988
Create a Home Valuation Report for This Property
The Home Valuation Report is an in-depth analysis detailing your home's value as well as a comparison with similar homes in the area
Home Values in the Area
Average Home Value in this Area
Purchase History
| Date | Buyer | Sale Price | Title Company |
|---|---|---|---|
| Eyong Takem Scholar N | $90,000 | Attorney | |
| Federal Home Loan Mortgage Corporation | $92,000 | None Available | |
| -- | -- | -- | |
| -- | $80,500 | -- |
Source: Public Records
Mortgage History
| Date | Status | Borrower | Loan Amount |
|---|---|---|---|
| Previous Owner | Eyong Takem Scholar N | $88,369 |
Source: Public Records
Tax History
| Year | Tax Paid | Tax Assessment Tax Assessment Total Assessment is a certain percentage of the fair market value that is determined by local assessors to be the total taxable value of land and additions on the property. | Land | Improvement |
|---|---|---|---|---|
| 2025 | $3,997 | $89,050 | $20,690 | $68,360 |
| 2024 | $3,997 | $89,050 | $20,690 | $68,360 |
| 2023 | $3,945 | $89,050 | $20,690 | $68,360 |
| 2022 | $2,821 | $54,390 | $12,530 | $41,860 |
| 2021 | $2,826 | $54,390 | $12,530 | $41,860 |
| 2020 | $2,830 | $54,390 | $12,530 | $41,860 |
| 2019 | $2,300 | $37,910 | $9,280 | $28,630 |
| 2018 | $2,386 | $37,910 | $9,280 | $28,630 |
| 2017 | $2,298 | $37,910 | $9,280 | $28,630 |
| 2016 | $2,729 | $41,200 | $8,720 | $32,480 |
| 2015 | $2,478 | $41,200 | $8,720 | $32,480 |
| 2014 | $2,484 | $41,200 | $8,720 | $32,480 |
| 2013 | $1,289 | $43,365 | $9,170 | $34,195 |
Source: Public Records
Map
Nearby Homes
- 1638 Arrowood Loop N
- 5352 Hazelwood Rd
- 1469 Sandalwood Place
- 5524 Driftwood Rd
- 5486 Pine Bluff Rd
- 5010 Julie Place
- 5004 Julie Place
- 4979 Lyle Rd
- 1452 Ironwood Dr
- 1685 Norma Rd
- 1485 Norma Rd
- 4923 Karl Rd Unit 4925
- 1687 Brookfield Square S
- 1905 Denise Dr
- 1439 Firwood Dr
- 4857 Tamarack Blvd
- 4852 Snowbird Cir Unit 13B
- 1523 Hempwood Dr
- 5480 Rockwood Ct Unit R1
- 5705 Tamarack Blvd Unit F
- 5293 Arrowood Loop W
- 5277 Arrowood Loop W
- 5301 Arrowood Loop W
- 5269 Arrowood Loop W
- 5286 Karl Rd Unit 288
- 5298 Karl Rd Unit 300
- 5298-5300 Karl Rd
- 5300 Karl Rd
- 5274 Karl Rd Unit 276
- 5286 Arrowood Loop W
- 5308 Karl Rd Unit 310
- 5278 Arrowood Loop W
- 5307 Arrowood Loop W
- 5292 Arrowood Loop W
- 5257 Arrowood Loop W
- 5310 Karl Rd
- 5266 Arrowood Loop W
- 5298 Arrowood Loop W
- 5264 Karl Rd Unit 266
- 5316 Karl Rd Unit 318
Your Personal Tour Guide
Ask me questions while you tour the home.