Estimated Value: $258,000 - $281,000
3
Beds
2
Baths
1,042
Sq Ft
$260/Sq Ft
Est. Value
About This Home
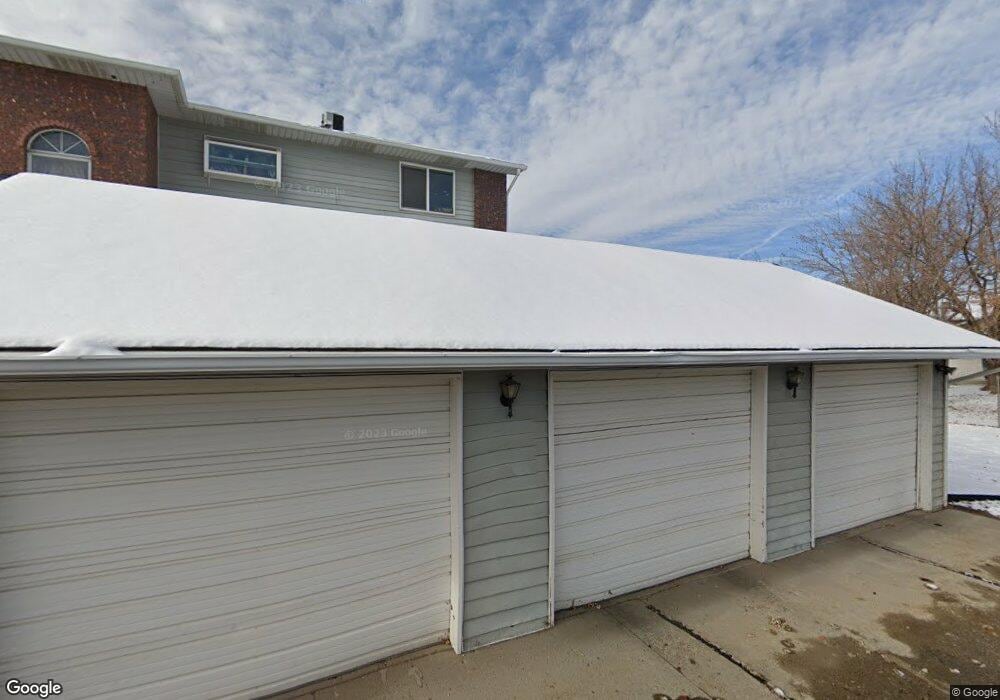
This home is located at 5285 S 2800 W Unit 1A, Roy, UT 84067 and is currently estimated at $271,038, approximately $260 per square foot. 5285 S 2800 W Unit 1A is a home located in Weber County with nearby schools including Roy Elementary School, Roy Junior High School, and Roy High School.
Ownership History
Date
Name
Owned For
Owner Type
Purchase Details
Closed on
Jun 24, 2021
Sold by
Hammond Alex and Hammond Shaydel
Bought by
Brown Andrew
Current Estimated Value
Purchase Details
Closed on
Apr 30, 2019
Sold by
Hoskins Jared D
Bought by
Hammond Alex and Hammond Shaydel
Purchase Details
Closed on
Aug 26, 2008
Sold by
Taylor Fern H and Bybee Connie
Bought by
Hoskins Jared D
Home Financials for this Owner
Home Financials are based on the most recent Mortgage that was taken out on this home.
Original Mortgage
$109,350
Interest Rate
6.27%
Mortgage Type
FHA
Create a Home Valuation Report for This Property
The Home Valuation Report is an in-depth analysis detailing your home's value as well as a comparison with similar homes in the area
Home Values in the Area
Average Home Value in this Area
Purchase History
| Date | Buyer | Sale Price | Title Company |
|---|---|---|---|
| Brown Andrew | -- | Backman Ntp | |
| Hammond Alex | -- | Mountain View Title Ogden | |
| Hoskins Jared D | -- | Bonneville Superior Title Co |
Source: Public Records
Mortgage History
| Date | Status | Borrower | Loan Amount |
|---|---|---|---|
| Previous Owner | Hoskins Jared D | $109,350 |
Source: Public Records
Tax History Compared to Growth
Tax History
| Year | Tax Paid | Tax Assessment Tax Assessment Total Assessment is a certain percentage of the fair market value that is determined by local assessors to be the total taxable value of land and additions on the property. | Land | Improvement |
|---|---|---|---|---|
| 2025 | $1,424 | $259,580 | $65,000 | $194,580 |
| 2024 | $1,424 | $139,150 | $35,750 | $103,400 |
| 2023 | $1,410 | $138,050 | $35,750 | $102,300 |
| 2022 | $1,357 | $135,300 | $35,750 | $99,550 |
| 2021 | $1,179 | $195,000 | $25,000 | $170,000 |
| 2020 | $1,037 | $157,000 | $25,000 | $132,000 |
| 2019 | $1,007 | $144,000 | $25,000 | $119,000 |
| 2018 | $851 | $115,000 | $20,000 | $95,000 |
| 2017 | $707 | $90,000 | $15,000 | $75,000 |
| 2016 | $601 | $41,250 | $8,250 | $33,000 |
| 2015 | $435 | $30,800 | $11,000 | $19,800 |
| 2014 | $440 | $30,800 | $11,000 | $19,800 |
Source: Public Records
Map
Nearby Homes
- 5317 S 2690 W
- 5063 S 2825 W
- 5056 S 2800 W
- 2786 W 5550 S Unit C11
- 2778 W 5550 S Unit 28
- 5003 S 2825 W
- 5009 S 2925 W
- 5321 S 3100 W
- 5326 S 2675 W
- 5432 S 3150 W
- 4918 S 2925 W
- 5024 S 2575 W
- 4891 S 2875 W
- 5538 S 3150 W
- 4919 S 2675 W
- 2646 W 5625 S Unit M-2646
- 5345 S 2425 W
- 4875 S 2675 W
- 3166 W 5625 S
- 3176 W 5625 S
- 5285 S 2800 W Unit 1F
- 5285 S 2800 W Unit 1E
- 5285 S 2800 W Unit 1C
- 5285 S 2800 W Unit 1B
- 5285 S 2800 W Unit F-1
- 5285 S 2800 W
- 5285 S 2800 W Unit 1D
- 5285 S 2800 W Unit C1
- 5309 S 2800 W
- 5273 S 2800 W Unit 2F
- 5273 S 2800 W Unit 2E
- 5273 S 2800 W Unit 2D
- 5273 S 2800 W Unit 2B
- 5273 S 2800 W Unit 2A
- 5273 S 2800 W Unit C2
- 5273 S 2800 W
- 2796 W 5300 S
- 5315 S 2800 W
- 5279 2775 St W Unit 3C
- 5270 S 2800 W Unit 3D