Estimated Value: $436,000 - $476,000
3
Beds
2
Baths
1,215
Sq Ft
$374/Sq Ft
Est. Value
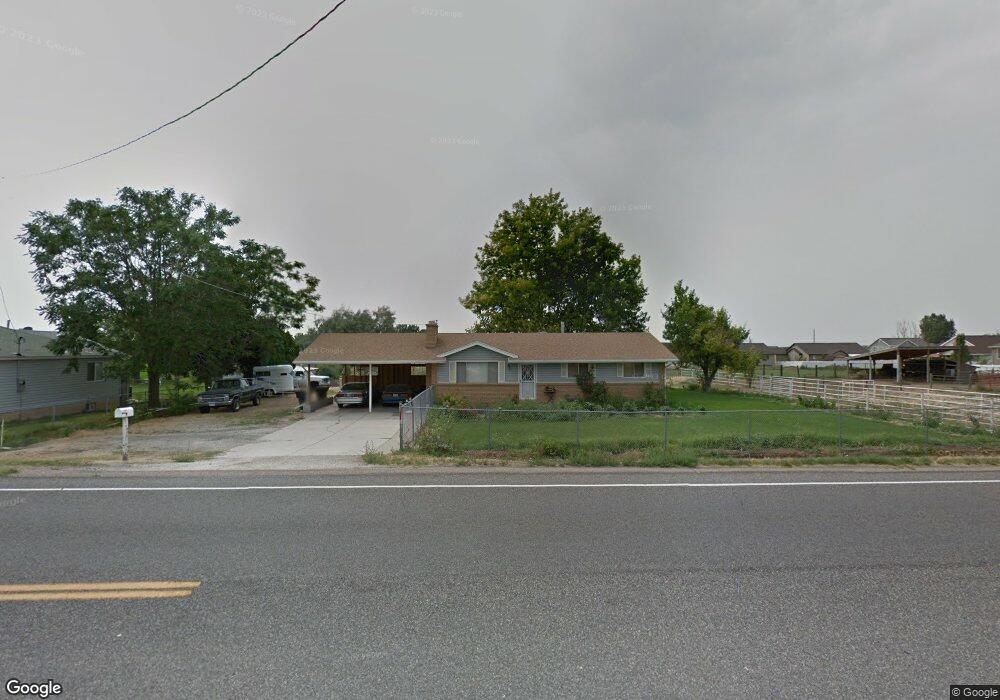
About This Home
This home is located at 5285 S 3500 W, Roy, UT 84067 and is currently estimated at $454,473, approximately $374 per square foot. 5285 S 3500 W is a home located in Weber County with nearby schools including Freedom School, Roy Junior High School, and Roy High School.
Ownership History
Date
Name
Owned For
Owner Type
Purchase Details
Closed on
Sep 27, 2006
Sold by
Gibson Kurt J
Bought by
Brinkerhoff Priscilla C and James Karen L
Current Estimated Value
Home Financials for this Owner
Home Financials are based on the most recent Mortgage that was taken out on this home.
Original Mortgage
$177,219
Outstanding Balance
$105,633
Interest Rate
6.44%
Mortgage Type
FHA
Estimated Equity
$348,840
Purchase Details
Closed on
Jul 21, 2004
Sold by
Newey Sherry
Bought by
Gibson Kurt J
Home Financials for this Owner
Home Financials are based on the most recent Mortgage that was taken out on this home.
Original Mortgage
$145,124
Interest Rate
6.27%
Mortgage Type
VA
Purchase Details
Closed on
Feb 1, 1999
Sold by
Newey Carl
Bought by
Newey Sherry
Purchase Details
Closed on
Jun 2, 1998
Sold by
Newey Carl and Newey Sherry
Bought by
Newey Sherry
Purchase Details
Closed on
May 1, 1997
Sold by
Newey Brad C
Bought by
Newey Sherry
Home Financials for this Owner
Home Financials are based on the most recent Mortgage that was taken out on this home.
Original Mortgage
$76,500
Interest Rate
8.14%
Mortgage Type
FHA
Create a Home Valuation Report for This Property
The Home Valuation Report is an in-depth analysis detailing your home's value as well as a comparison with similar homes in the area
Home Values in the Area
Average Home Value in this Area
Purchase History
| Date | Buyer | Sale Price | Title Company |
|---|---|---|---|
| Brinkerhoff Priscilla C | -- | Equity Title South Ogden | |
| Gibson Kurt J | -- | Surety Title | |
| Newey Sherry | -- | -- | |
| Newey Sherry | -- | -- | |
| Newey Sherry | -- | -- | |
| Newey Sherry | -- | -- |
Source: Public Records
Mortgage History
| Date | Status | Borrower | Loan Amount |
|---|---|---|---|
| Open | Brinkerhoff Priscilla C | $177,219 | |
| Previous Owner | Gibson Kurt J | $145,124 | |
| Previous Owner | Newey Sherry | $76,500 |
Source: Public Records
Tax History
| Year | Tax Paid | Tax Assessment Tax Assessment Total Assessment is a certain percentage of the fair market value that is determined by local assessors to be the total taxable value of land and additions on the property. | Land | Improvement |
|---|---|---|---|---|
| 2025 | $2,777 | $413,801 | $134,936 | $278,865 |
| 2024 | $2,721 | $224,520 | $74,214 | $150,306 |
| 2023 | $2,521 | $206,844 | $71,243 | $135,601 |
| 2022 | $2,737 | $231,550 | $58,038 | $173,512 |
| 2021 | $2,372 | $329,000 | $89,335 | $239,665 |
| 2020 | $2,201 | $279,999 | $89,335 | $190,664 |
| 2019 | $2,101 | $252,000 | $58,438 | $193,562 |
| 2018 | $1,976 | $236,000 | $58,438 | $177,562 |
| 2017 | $1,749 | $200,000 | $54,188 | $145,812 |
| 2016 | $1,570 | $96,195 | $28,284 | $67,911 |
| 2015 | $1,482 | $89,655 | $28,284 | $61,371 |
| 2014 | $1,169 | $66,332 | $28,284 | $38,048 |
Source: Public Records
Map
Nearby Homes
- 3443 W 5200 S Unit 2&3
- 5321 S 3100 W
- 3509 W 4835 S Unit 26
- 5556 S 3800 W
- 3517 W 4835 S Unit 27
- 5412 S 3925 W
- 5304 S 3100 W
- 3832 W 5625 S
- 3959 W 5325 S
- 3176 W 5625 S
- 3166 W 5625 S
- 5444 S 4050 W
- 3826 W 5750 S
- 5141 S 2975 W
- 4950 3900 West St
- 5854 S 3500 W
- 4813 S 3850 W
- 5791 S 3260 W
- 4021 W 5625 S
- 5773 S 3850 W
Your Personal Tour Guide
Ask me questions while you tour the home.