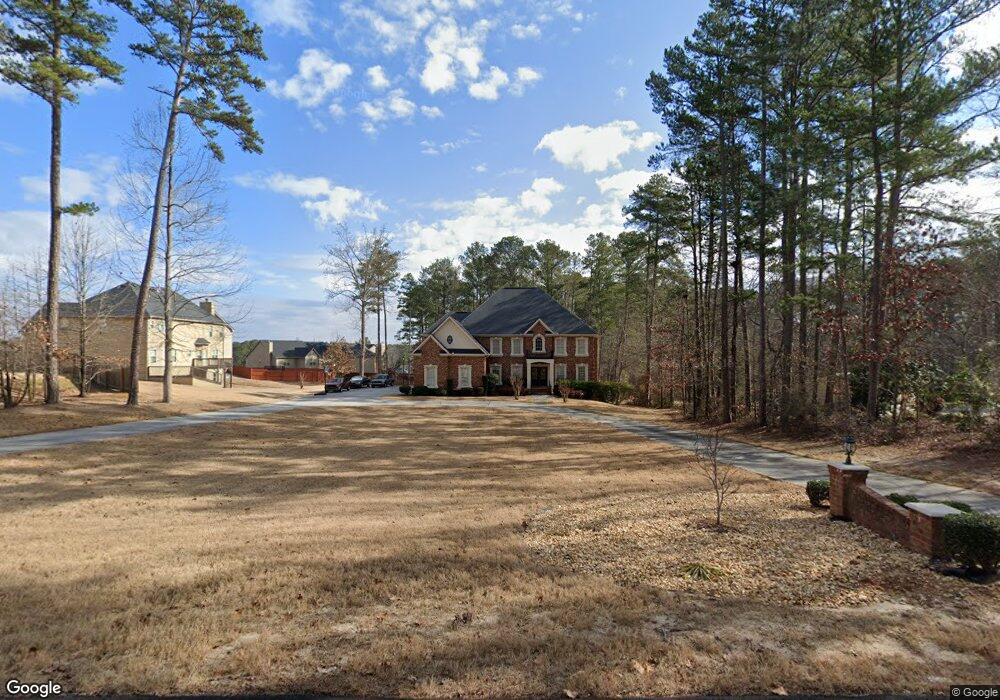
5285 Whispering Pines Ln NW Conyers, GA 30012
Estimated Value: $525,000 - $872,000
5
Beds
6
Baths
4,007
Sq Ft
$173/Sq Ft
Est. Value
About This Home
This home is located at 5285 Whispering Pines Ln NW, Conyers, GA 30012 and is currently estimated at $691,319, approximately $172 per square foot. 5285 Whispering Pines Ln NW is a home with nearby schools including Rosebud Elementary School, Grace Snell Middle School, and South Gwinnett High School.
Ownership History
Date
Name
Owned For
Owner Type
Purchase Details
Closed on
Jun 22, 2021
Sold by
Myers Trainel Christian
Bought by
Myers Trainel Christian and Myers Jeffery
Current Estimated Value
Purchase Details
Closed on
Apr 29, 2005
Sold by
Wade Annette M
Bought by
Myers Jeffrey A
Home Financials for this Owner
Home Financials are based on the most recent Mortgage that was taken out on this home.
Original Mortgage
$73,150
Interest Rate
5.99%
Mortgage Type
New Conventional
Purchase Details
Closed on
Jun 4, 2002
Sold by
Reynolds Sonja
Bought by
Bankers Tr Co Ca
Purchase Details
Closed on
Jan 26, 1994
Sold by
Freeman Linda J
Bought by
Macfarlane Joanne
Create a Home Valuation Report for This Property
The Home Valuation Report is an in-depth analysis detailing your home's value as well as a comparison with similar homes in the area
Home Values in the Area
Average Home Value in this Area
Purchase History
| Date | Buyer | Sale Price | Title Company |
|---|---|---|---|
| Myers Trainel Christian | -- | -- | |
| Myers Jeffrey A | $77,000 | -- | |
| Myers Jeffrey A | $77,000 | -- | |
| Bankers Tr Co Ca | $113,900 | -- | |
| Macfarlane Joanne | $45,000 | -- |
Source: Public Records
Mortgage History
| Date | Status | Borrower | Loan Amount |
|---|---|---|---|
| Previous Owner | Myers Jeffrey A | $73,150 |
Source: Public Records
Tax History Compared to Growth
Tax History
| Year | Tax Paid | Tax Assessment Tax Assessment Total Assessment is a certain percentage of the fair market value that is determined by local assessors to be the total taxable value of land and additions on the property. | Land | Improvement |
|---|---|---|---|---|
| 2025 | $8,159 | $257,840 | $38,640 | $219,200 |
| 2024 | $8,338 | $257,840 | $38,640 | $219,200 |
| 2023 | $8,338 | $257,840 | $38,640 | $219,200 |
| 2022 | $6,834 | $186,200 | $21,600 | $164,600 |
| 2021 | $6,936 | $186,200 | $21,600 | $164,600 |
| 2020 | $7,203 | $186,200 | $21,600 | $164,600 |
| 2019 | $6,640 | $177,560 | $17,000 | $160,560 |
| 2018 | $6,656 | $177,560 | $17,000 | $160,560 |
| 2016 | $5,053 | $131,440 | $14,760 | $116,680 |
| 2015 | $5,114 | $131,440 | $14,760 | $116,680 |
| 2014 | -- | $131,440 | $14,760 | $116,680 |
Source: Public Records
Map
Nearby Homes
- 2781 Jen Chris Dr
- 4745 Matthews Park Dr
- 2921 Lee Rd SW
- 4616 Lenora Church Rd
- 4596 Lenora Church Rd
- 316 Cedar Hollow Dr
- 2831 Centerville Rosebud Rd
- 4810 Lenora Church Rd
- 4705 Duration Ct
- 4325 Haynes Cir SW
- 3331 Metro Way
- 5191 Highway 20 NE
- 4567 Eon Ct
- 5009 Duval Point Way SW
- 2100 NE Indian Shoals Dr
- 2910 Centerville Rosebud Rd
- 4680 Duval Point Way SW
- 5260 Whispering Pines Ln NW
- 5270 Whispering Pines Ln NW
- 5263 Whispering Pines Ln NW
- 5255 Whispering Pines Ln NW
- 5275 Whispering Pines Ln NW
- 5280 Whispering Pines Ln NW
- 5250 Whispering Pines Ln NW
- 4739 Polly Place
- 4739 Polly Place Unit 49
- 4740 Polly Place
- 4740 Polly Place Unit 48
- 4730 Polly Place
- 4730 Polly Place Unit 47
- 4729 Polly Place
- 4729 Polly Place Unit 50
- 4721 Amanda Louisa Ct Unit 42
- 5240 Whispering Pines Ln NW
- 4734 Amanda Louisa Ct
- 4734 Amanda Louisa Ct Unit 41
- 5290 Whispering Pines Ln NW